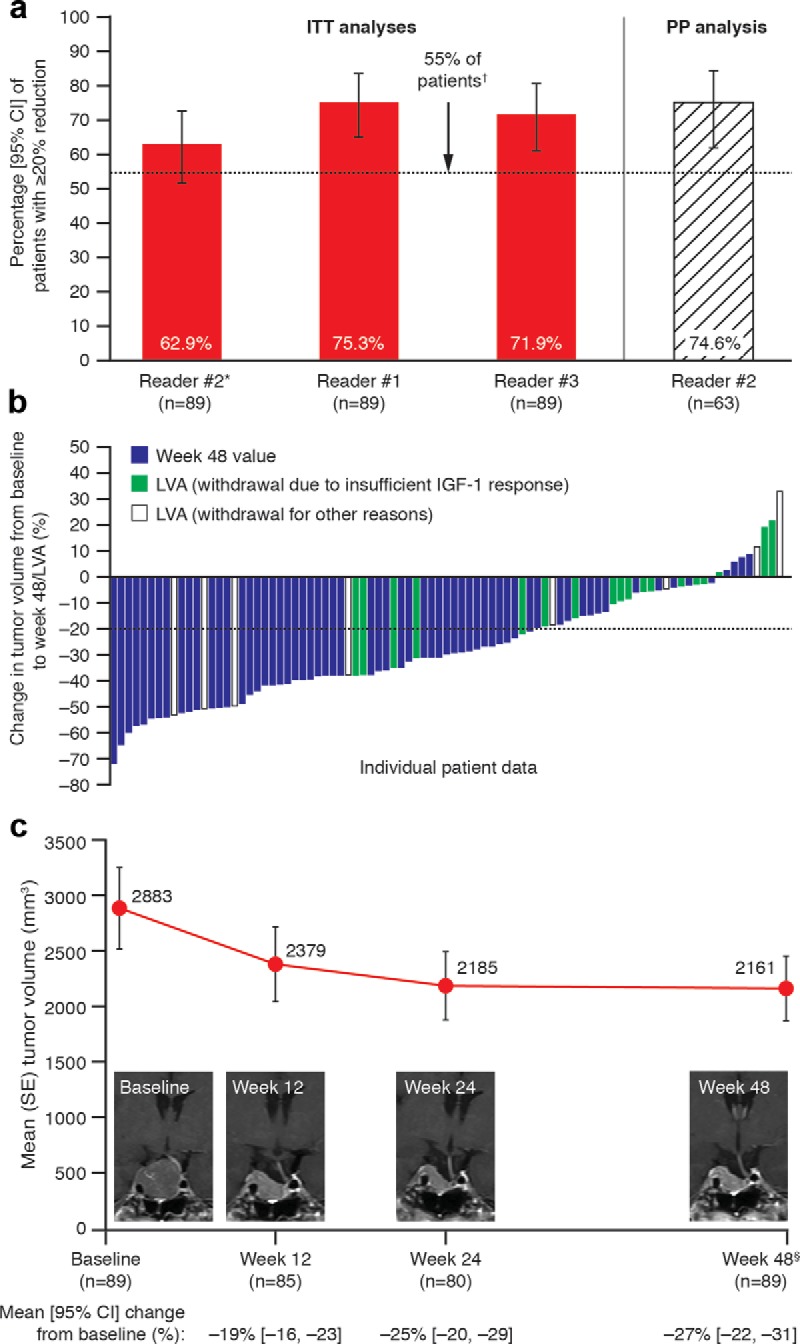
Figure 3.

Reductions in tumor volume. A, Analyses of the proportions of patients with ≥ 20% reduction in tumor volume from baseline to week 48/LVA (primary endpoint; ITT and PP populations). B, Tumor volume reductions for individual patients (ITT population). C, Time course of changes in tumor volume reductions (ITT population) with an illustrative MRI series from one patient. The four patients with greatest increases in tumor volumes (all based on LVA measurements) in panel B had IGF-1 changes ranging from +9.8% to −40.9%. The patient with the greatest increase in tumor volume (33.1%) discontinued in the study at week 24 after discussions about the increase with the investigator. *, Primary analysis based on highest SSR; †, proportions and 95% CIs for each reader dataset were compared with the predetermined threshold of 55%; §, data are from week 48 or LVA.
