
Figure 4.
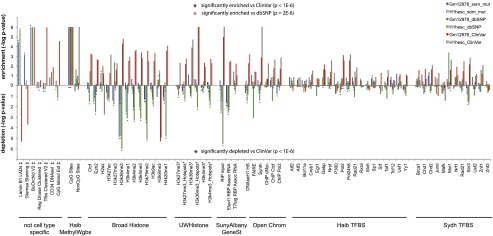
Enrichment and depletion of somatic mutations in functional genomic elements tracked by ENCODE. Enrichment depletion analysis: (y-axis) −log P-values indicate the enrichment or depletion of somatic mutations (blue bar), dbSNP variants (green bar), and ClinVar (red bar) variants for each functional element tracked by ENCODE. The lowest possible P-value = 1 × 10⁻⁶, or –log P-value = 6. Comparative analysis: (Black stars) Variant set is significantly enriched (star above bars) or depleted (star below bars) relative to ClinVar variants, P < 1 × 10⁻⁶. Pink star (BU ORChID track only) Variant set is significantly enriched relative to dbSNP variants. Comparisons of other variant sets did not yield significant differences. (‡) Tracks are not specific for cell lines. (*) Track not available for H1 hESC, track for H7 human embryonic stem cell line used instead.