Figure 2.
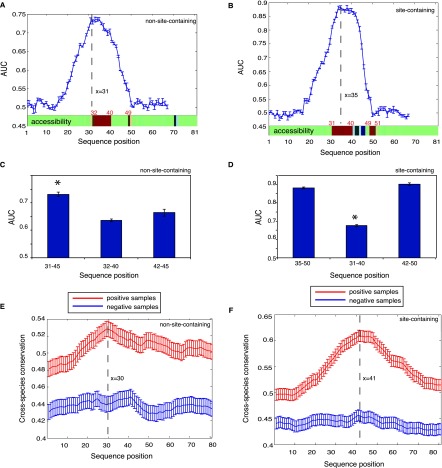
Dissecting sequence features underlying AGO target recognition for RNA fragments that have or do not have miRNA binding sites. (A,B) (Blue curve) AUC for predicting AGO binding using a 15-nt window on the independent test set sliding over the 81-nt sequences. Structural accessibility of each nucleotide is shown at the bottom (above the x-axis), where green, red, and blue represent unchanged, elevated, or reduced accessibility in comparison with the negative samples (false discovery rate <0.01). Statistical significance was determined by the paired Wilcoxon rank sum test between the positive and negative samples. (C,D) The discriminative power for the most defining regions (left column, corresponding to the peaks on the blue curves), the most accessible regions (middle column), and the subregions of the most defining regions after the crosslinking sites (right column). (E,F) Seventeen-way phastCons scores (y-axis indicates cross-species evolutionary conservation) of each nucleotide for an RNA fragment without (E) and with (F) miRNA binding sites. It is clear that AGO-associated sequences (the positive samples in red) tend to be more conserved than the negative samples (in blue). The highly accessible regions immediately flank the peaks, indicating elevated conservation for these regions of high accessibility. Error bars, 1 SEM.

