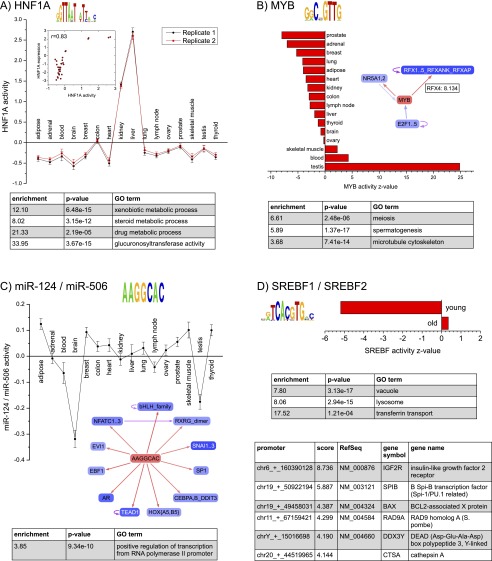
Figure 2.
Results for the Illumina Body Map 2. Each panel corresponds to a motif (indicated with name and sequence logo) and shows the inferred motif activities across the 16 tissues (activities with error bars in panels A and C, and activity Z-values in panels B and D). Tables show Gene Ontology categories enriched among predicted targets of each motif, and individual target promoters (D). The networks (B,C) show direct regulatory interactions between the motif and other regulators. (A) Red and black curves correspond to motif activities from two replicate measurements. The inset shows the correlation between motif activity and HNF1A mRNA levels. (B) The inset shows that MYB is predicted to directly target the RFX4 promoter with target score 8.134. (C) The regulatory network inset and GO table show that hsa-miR-124/hsa-miR-506 is predicted to directly target many TFs. (D) The red bars show Z-values of the average motif activity of the SREBF motif for samples coming from older (age 58–86) and younger (age 19–47) donors.

