
Figure 3.
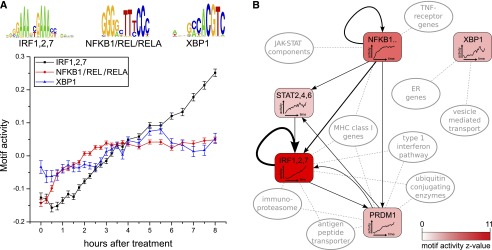
Analysis of an inflammatory response time series of human umbilical vein endothelial cells responding to TNF. (A) Time-dependent activities of the three most significant motifs, i.e., NFKB1/REL/RELA (red), IRF1/2/7 (black), and XBP1 (blue). Error bars denote standard deviations of the inferred activities. (B) Summary of the inferred core regulatory network. Selected top motifs are shown together with interactions between them and pathways/functional categories that are enriched among the targets of these motifs. The intensity of the color corresponds to the Z-score of the motif, its time-dependent activity is indicated inside the node, and the thickness of each edge corresponds to its target score Spm.