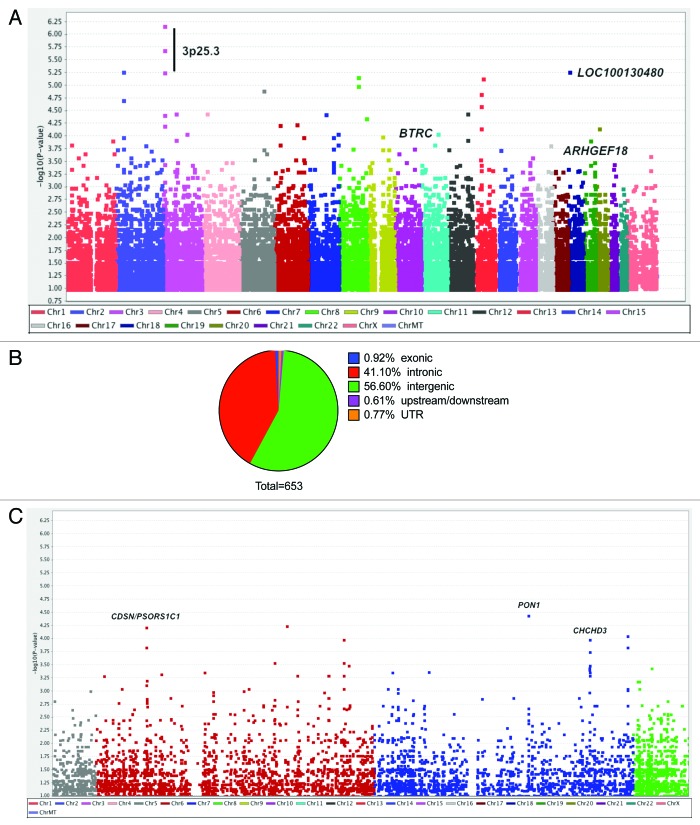
Figure 1. Genome-wide analysis of 875,967 SNPs in 12 cases of SCLS and 18 control subjects. (A) Manhattan plot showing negative log-transformed P values of the case-control allele frequency significance on the y-axis. The color scale of the x-axis denotes chromosome numbers. Gene names associated with individual dots indicate SNPs of greatest significance or with potential disease relevance. (B) Distribution of 653 SNPs meeting the established criterion for genome-wide significance (P ≤ 1 × 10⁻³, Chi square test). (C) Expanded view of chromosomes 6–7, which contain regions of neighboring SNPs highly associated with SCLS.

An official website of the United States government
Here's how you know
Official websites use .gov
A
.gov website belongs to an official
government organization in the United States.
Secure .gov websites use HTTPS
A lock (
) or https:// means you've safely
connected to the .gov website. Share sensitive
information only on official, secure websites.
