
Fig. 2.
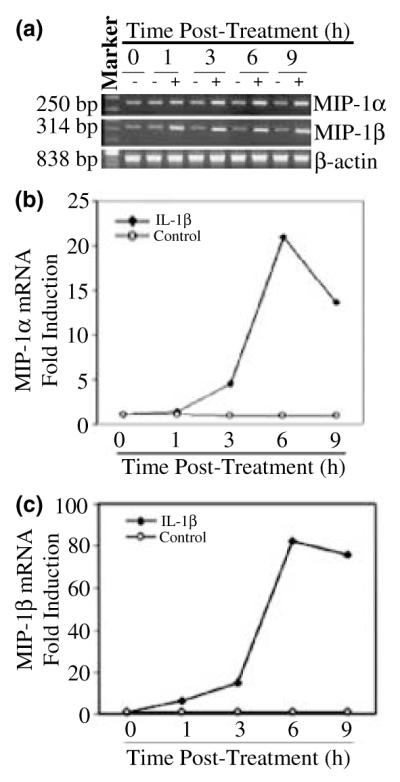
Time course of IL-1β effect on MIP-1α and -1β mRNA expression in NT2-N cells. NT2-N cells were incubated with (+) or without (−) IL-1β (4 ng/mL) and expression was measured at the indicated times after treatment. (a) Total RNA was isolated and subjected to RT–PCR and electrophoresis for MIP-1α and -1β mRNA. Expression of MIP-1α (b) and MIP-1β (c) mRNA in NT2-N cells was also quantified by real-time RT–PCR. Data are means of triplicate cultures, representative of three independent experiments.