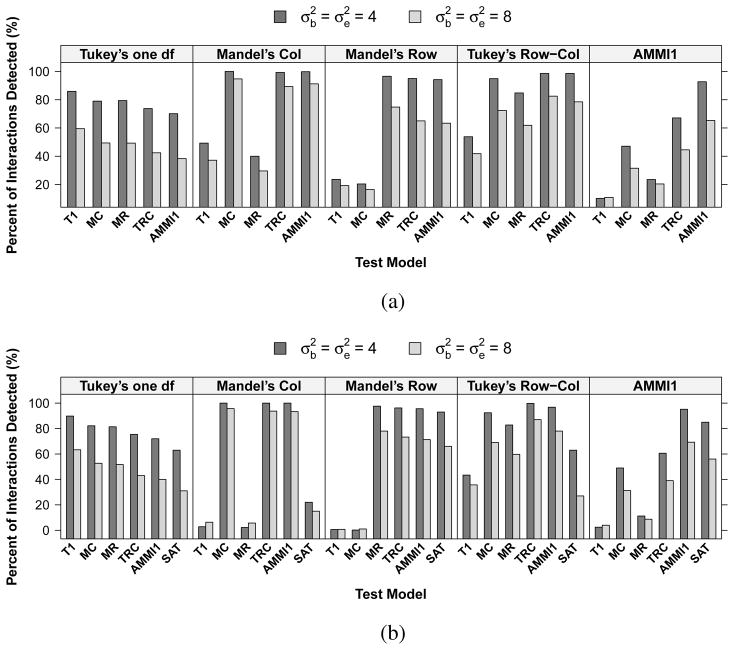
Fig. 4.
Percentage of interactions detected by different interaction models in the simulation settings corresponding to a 3 ×3 array. Results are based on (a) the likelihood ratio test with the cell-mean approach (LRT-CM) and (b) the parametric bootstrap test (LRT-PB) with test results of using a saturated model for interaction as a comparison. The top label within each box represents the true simulation model. The horizontal-axis labels indicate the models used for testing interaction. T1 = Tukey’s one degree-of-freedom non-additivity test (a), MC = Mandel’s column model (b), MR = Mandel’s row model (c), TRC = Tukey’s row-column model (d), AMMI1 = model (e), SAT = saturated interaction model.

