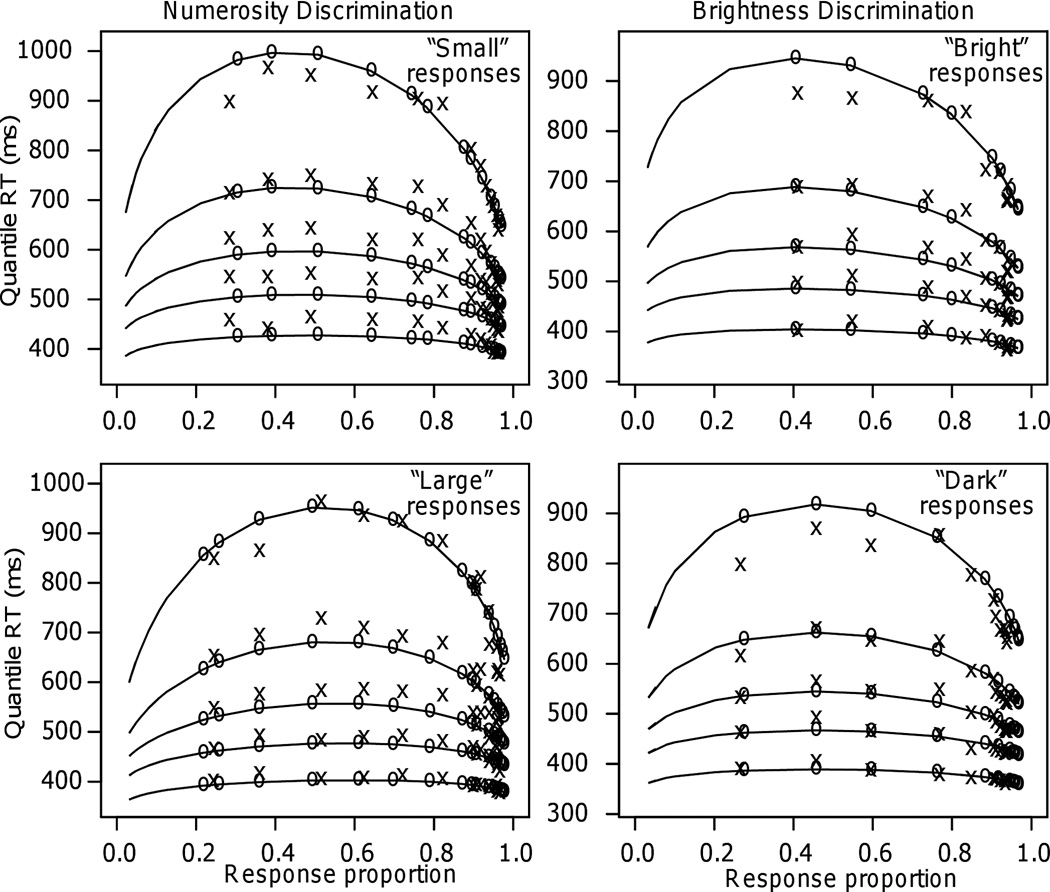
Figure 3.
Quantile probability plots for Experiments 1 and 6 (numerosity and brightness discrimination, respectively). The x’s represent the experimental data and the o’s joined by lines are the model predictions. The conditions are shown on the x axis in terms of proportions of responses. Proportions on the right are for correct responses and proportions on the left for error responses (some of the error quantiles are missing because some of the subjects had zero responses for those conditions). The RT quantiles are, in order from bottom to top, the .1, .3, .5, .7, and .9 quantiles.

