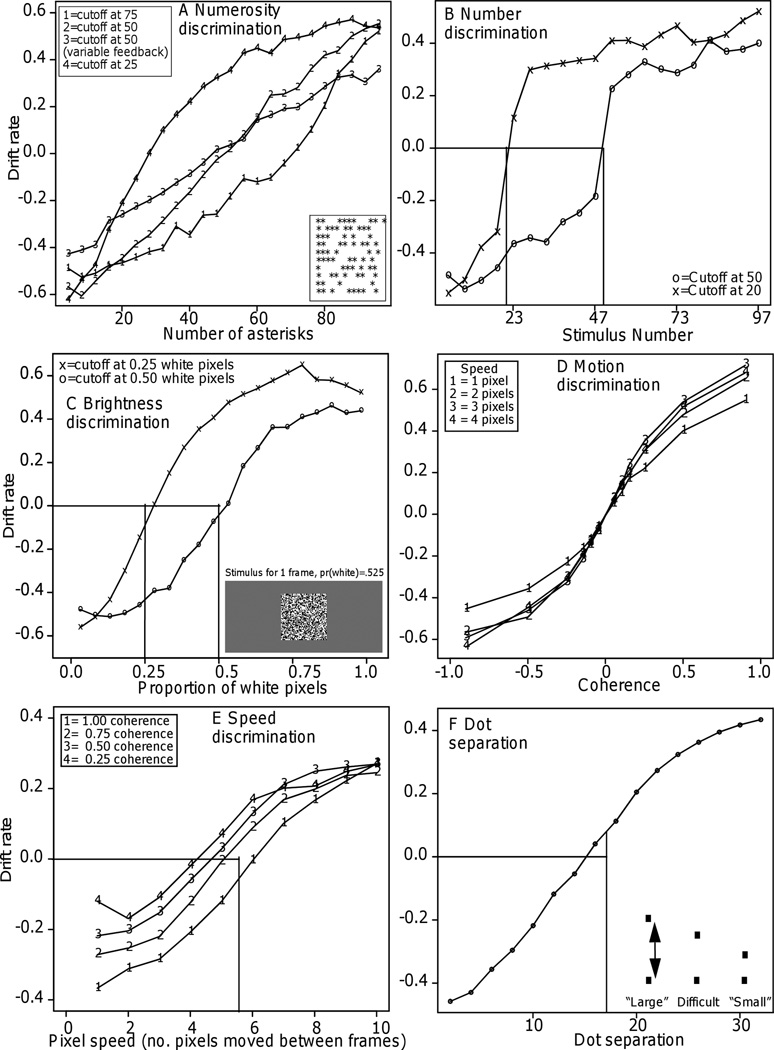
Figure 4.
Panel A: Drift rates as a function of number of asterisks for Experiments 1–4, the four numerosity discrimination experiments. The vertical lines show where the cutoffs for “large” and “small” stimuli should intersect with zero drift rate. For all four experiments, the drift rates were near zero at this point. The bottom right inset is an example of a stimulus.
Panel B: Drift rates as a function of number for Experiment 5. The vertical lines show where the cutoffs between “large” and “small” numbers should intersect with zero drift rate and the drift rates were near zero at this point.
Panel C: Drift rates as a function of the proportions of white pixels in Experiments 6 and 7 (brightness discrimination). The bottom right inset show an example stimulus. The vertical lines show where the cutoffs between “bright” and “dark” stimuli should intersect with zero drift rate and the drift rates were near zero at this point.
Panel D. Drift rates as a function of motion coherence (the proportion of dots moving coherently) and speed in Experiment 8 (direction discrimination).
Panel E: Drift rates as a function of speed and coherence for Experiment 9. The vertical line shows where the cutoff and zero drift rate intersect.
Panel F: Drift rate as a function of dot separation in Experiment 10. The bottom right inset shows examples of stimuli. The vertical lines show where the cutoffs between “large” and “small” dot separation should intersect with zero drift rate and the drift rates were near zero at this point.

