
Figure 5.
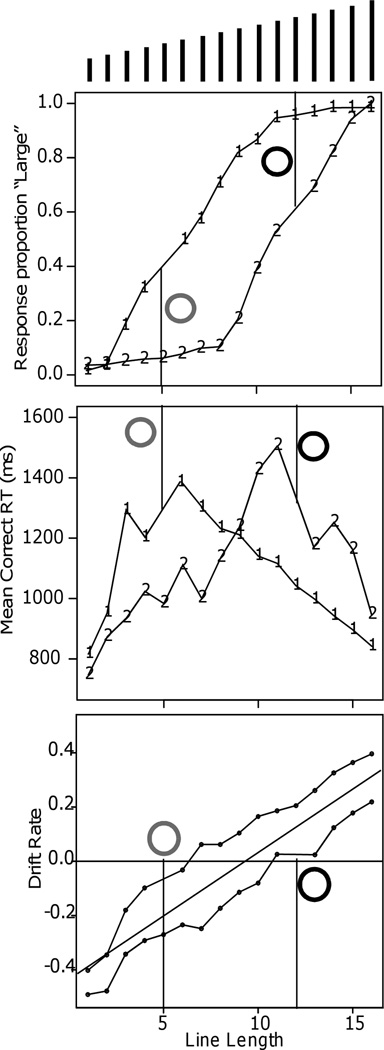
Response proportion, correct mean RT, and drift rates for the line length discrimination experiment (Experiment 11) ofGrinband et al. (2006). The grey and black circles represent the cues for the criterion manipulation (red and green in the experiment) and the vertical lines show the cutoffs for those cues. The lines at the top of the plot represent the stimuli.