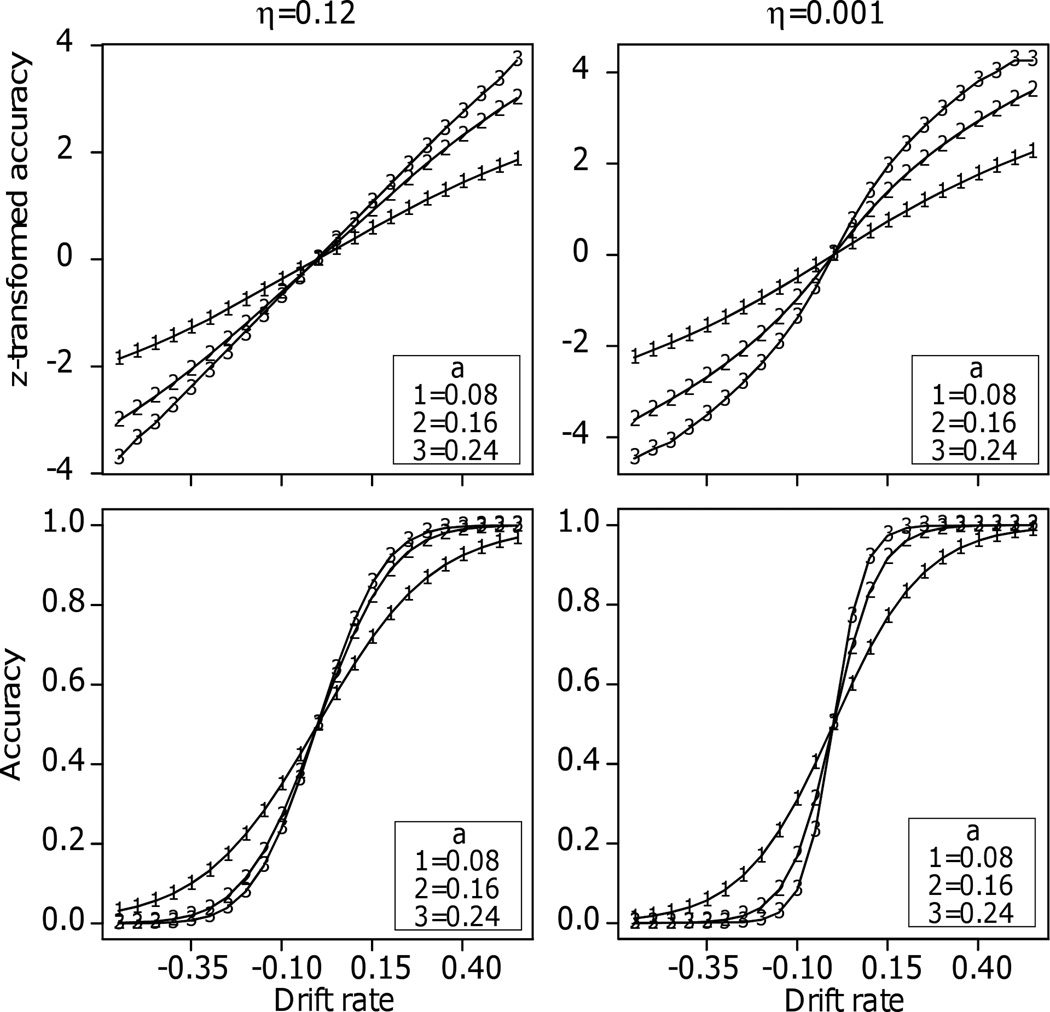
Figure 6.
Plots of z-transformed accuracy and accuracy against drift rate. Across trial variability in starting point was 0.04 and the other parameters are shown in the figure (nondecision time and across trial variability in nondecision time do not affect accuracy predictions). Boundary separation, a, is presented in the box in each panel.

