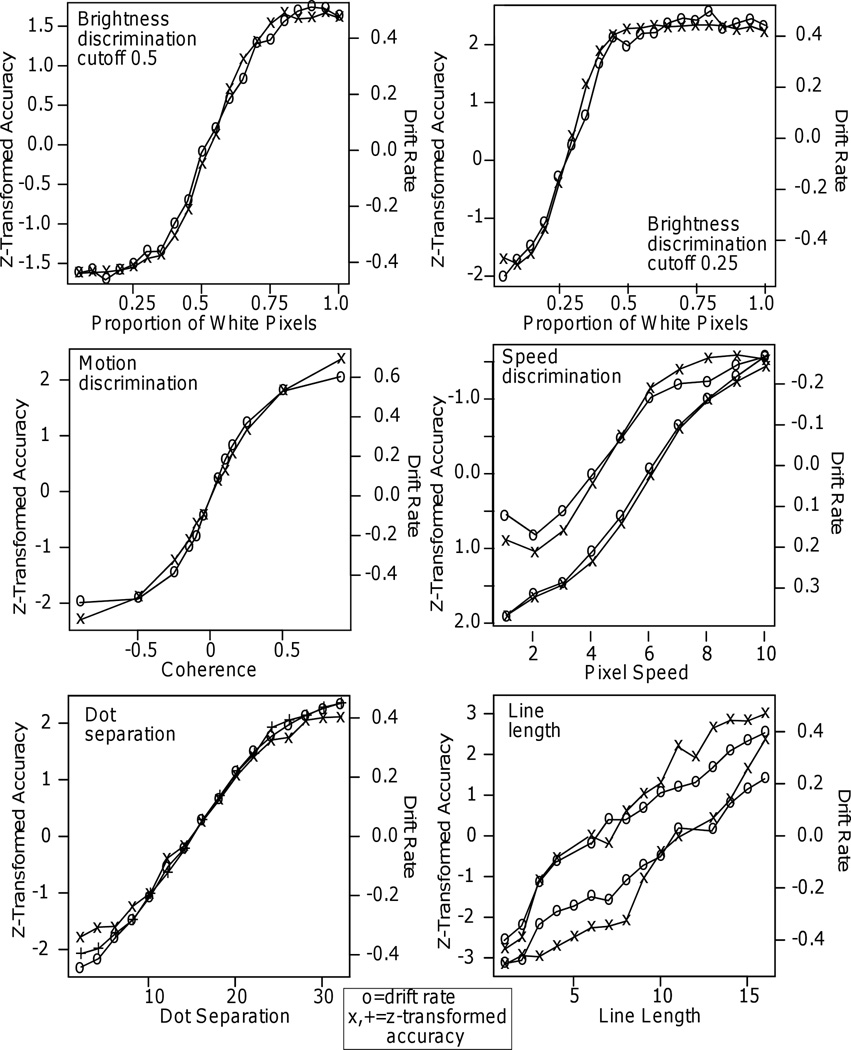
Figure 8.
Plots of drift rate and the z-transform of accuracy against the independent variable for Experiments 6 – 11. For the speed discrimination experiment, only the highest and lowest functions are shown to reduce clutter. The two intermediate accuracy functions show the same deviation between drift rate and z-transformed accuracy functions as for the lower accuracy functions.

