
Fig. 7.
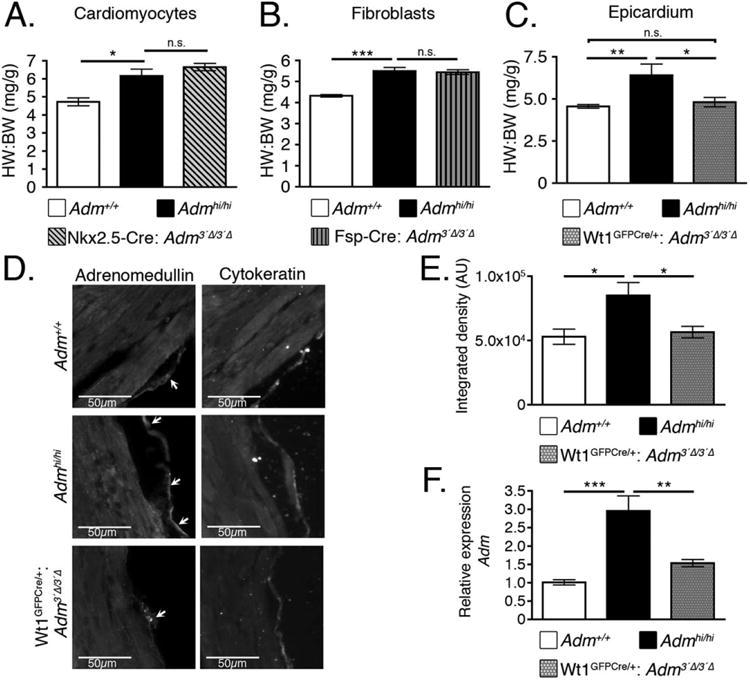
Epicardial-derived AM contributes to cardiac hyperplasia of Admhi/hi mice. A: Admhi/hi mice were crossed with the Nkx2.5-Cre mouse line to generate Admhi/hi animals with wild-type levels of Adm in cardiomyocytes. Heart weight to body weight (HW:BW) ratios were assessed at 2 months of age (n = 4–8). B: Admhi/hi mice were crossed to the Fsp-Cre mouse line to generate Admhi/hi mice with wild-type levels of Adm in fibroblasts. Heart weight to body weight (HW:BW) ratios were assessed at 2 months of age (n = 4–10). C: Admhi/hi mice were crossed with the Wt1GFPCre/+ mouse line to generate Admhi/hi mice with wild-type levels of Adm in the epicardium. At 2 months of age, heart weight to body weight (HW:BW) ratios were assessed (n = 3–6). D: Adjacent left ventricle sections from wild-type, Admhi/hi, and Wt1GFPCre/+:Adm3′Δ/3′Δ mice were stained with adrenomedullin (left panels) and the epicardial marker, cytokeratin (right panels). Adrenomedullin and cytokeratin images were acquired with a 130 ms exposure for all images. Images were acquired at ×20 magnification and the scale bar represents 50 μm. E: The amount of AM expressed in the epicardium was assessed from the images in panel D by measuring the integrated density using Image J software. The data are presented as arbitrary units (AU) of integrated density. F: RNA extracted from 2-month-old left ventricle samples was used to assess the relative expression levels of Adm by qRT-PCR. All values represent means ± SEM. *P < 0.05, **P < 0.01, ***P < 0.001