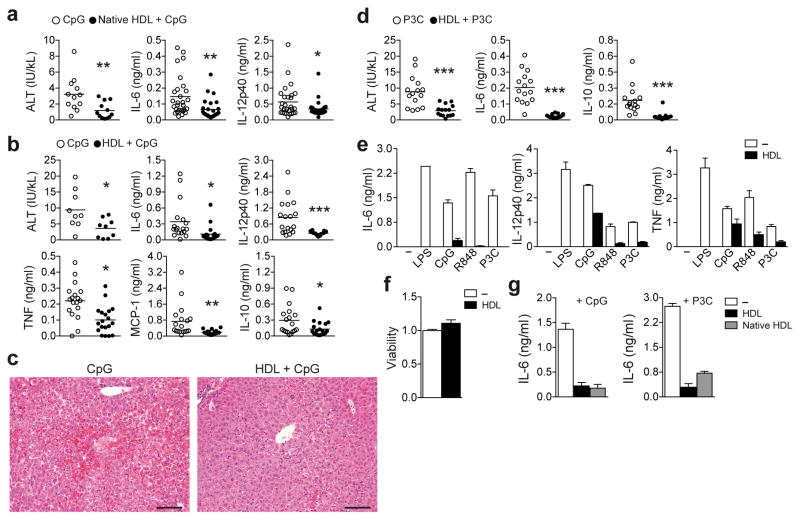
Figure 1.
HDL inhibits TLR-induced cytokine production from macrophages in vivo and in vitro. (a–d) Mice were injected intraperitoneally (i.p.) with 2 mg HDL for 6 h before i.p. injection of TLR ligand (CpG: 20 μg, P3C 2 μg) and D-galactosamine (10 mg). Serum cytokines were measured after 1 h and serum alanine aminotransferase (ALT) and liver histology after 10 h. a C3H/HeJ mice injected with native HDL and CpG: ALT release (n=12) and serum cytokines (CpG n=28, native HDL+CpG n= 27) were measured. b,c C57BL/6 mice injected with HDL and CpG: ALT release (n=9); serum cytokines (CpG n=18, HDL+CpG n=19) (b), and liver histology by hemotoxylin and eosin staining shows hepatic cell death. (c). d, C57BL/6 injected with HDL and P3C: ALT release (n=15) and serum cytokines (n=15) were measured. e, ELISA of BMDMs treated with 2 mg/ml HDL for 6 h followed by overnight stimulation with the TLR4 ligand, LPS (100 ng/ml); TLR9 ligand, CpG (100 nM); TLR7/8 ligand, R848 (5 ng/ml); or TLR2/1 ligand P3C (50 ng/ml). f, Cell viability was measured with CellTitre- Blue® reagent. g, BMDMs were pre-treated with recombinant or native HDL (2 mg/ml) for 6 h and stimulated overnight with CpG (100 nM) or P3C (50 ng/ml) and IL-6 cytokine secretion measured by ELISA. a,b,d Data are presented as mean values ±S.E.M, CpG versus HDLs+CpG *p<0.05, **p<0.01, ***p<0.005, c, images are representative of mice with median ALT concentration; scale bars, 100 μm, e,f,g data is shown as mean ±S.D. and is representative of at least three independent experiments.

