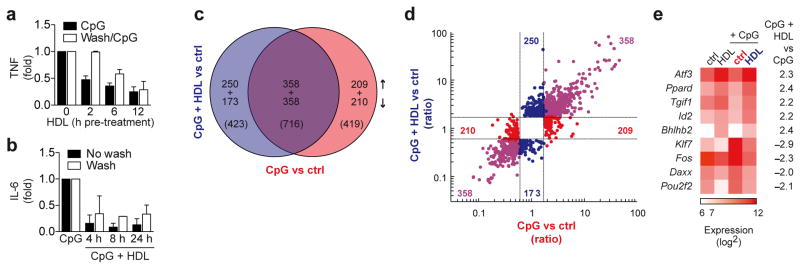
Figure 3.

Microarray analysis identifies ATF3 as a candidate gene for the anti-inflammatory function of HDL. a, Immortalized-BMDMs were pre-treated with HDL (2 mg/ml) for indicated times, then either washed twice in serum-free DMEM, or left unwashed, before overnight stimulation with CpG (100 nM). TNF secretion was measured by ELISA and normalized to CpG treatment alone. b, BMDMs were pre-treated with HDL (2 mg/ml) for 12 h, then either washed twice in serum-free DMEM, or left unwashed, before stimulation with CpG (100 nM) for indicated times. IL-6 was measured in culture supernatants and normalized to CpG treatment alone. c–f, Microarray analysis of BMDMs pre-treated for 6 h with HDL (2 mg/ml) then stimulated with CpG (100 nM) for 4 h. c, Venn diagram shows genes with differential expression (vs control) and the overlap in these genes (Fold Change limit 1.8, False discovery rate p<0.05). d, A fold change/fold change plot shows directional gene expression resulting from CpG treatment (red), CpG and HDL treatment (blue) or genes that are co-regulated in both treatments (purple). e, Expression of transcription factors following HDL, CpG or combined treatment as described in the methods and presented as a heat map. TFs are ranked according change in expression across treatments, while color intensity shows the mean expression value per condition. a,b, Representative data from at least three independent experiments (mean ±S.D) c–e, At least three biological replicates per condition were generated.
