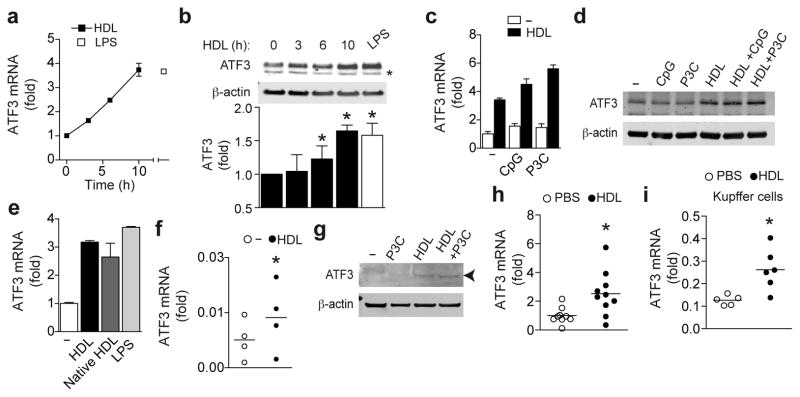
Figure 4.
HDL induces ATF3 expression. a,b, BMDMs were treated with HDL (2 mg/ml) for the indicated time points or LPS (200 ng/ml) for 6 h, and ATF3 mRNA expression (a) or protein (*indicates a non-specific band) relative to total β-actin was analyzed (b) c,d, BMDMs were pre-treated with HDL (2 mg/ml) for 6 h and stimulated with CpG (100 nM) or P3C (50 ng/ml) for 4 h : ATF3 mRNA (c) and ATF3 protein (d). e, BMDMs were treated with HDL or native HDL (2 mg/ml) or LPS for 10 h and ATF3 mRNA expression was measured by qPCR (e). f,g CD14+ monocytes were pre-treated with HDL as before, and stimulated with P3C (1 μg/ml) for 4 h; ATF3 mRNA expression (f) or protein (g). h,i, qPCR analysis of ATF3 mRNA expression in the livers (n=9) (h) or Kupffer cells (n=6) (i) of C57BL/6 mice 10 h after 2 mg i.p. HDL injection. a,c,e One of at least three independent experiments shown (mean ±S.D.) b, Representative immunoblot and densitometric analysis combined from four independent experiments (mean ±S.E.M, untreated versus HDL treated *p<0.05). d,g, Representative blot of at least two separate experiments. f, Data is represented as the mean from four individual donors (one-tailed student t test, untreated versus HDL treated *p<0.05) h,i Data are shown as the mean ±S.E.M, PBS versus HDL injected mice *p<0.05.

