Figure 5.
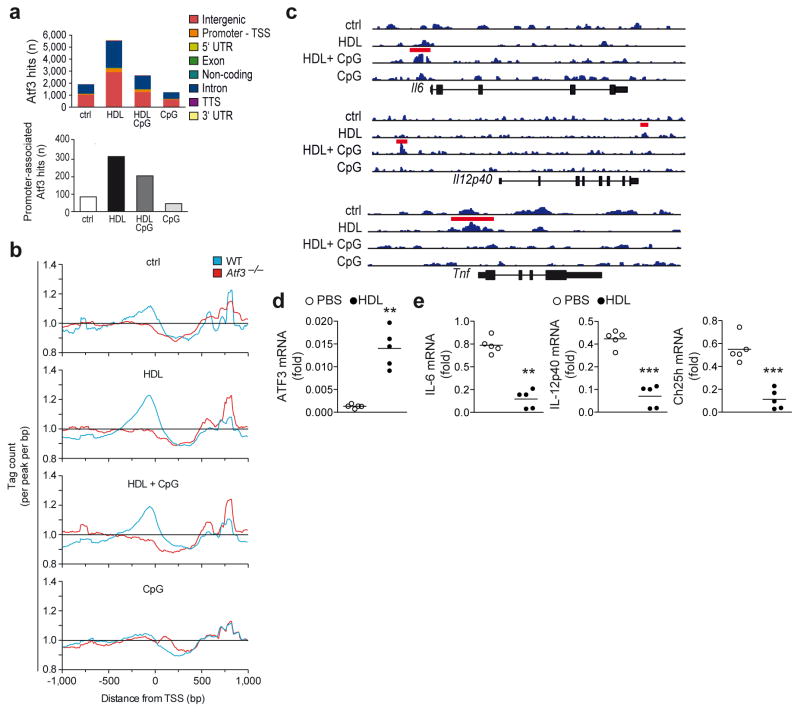
ATF3 is active following induction by HDL. a–c, ATF3 ChIP sequencing of BMDMs pre-treated with HDL (2 mg/ml) for 6 h followed by stimulation with CpG (100 nM) for 4 h. Distribution of ATF3 binding within the genome (upper) and promoter regions (lower panel) (a) and global ATF3 peak localization relative to transcription start site (TSS); normalized average of tags per peak per bp from −1kb to +1kb (b). Genomic loci of Il6, Il12p40 and Tnf with ChIP-Seq signals for ATF3 binding under the stimulation conditions, red bars indicate significant peaks (c). d,e qPCR analysis of ATF3, IL-6, IL-12p40 or Ch25h mRNA expression in livers from Apoe-deficient mice fed on a high fat diet diet and injected intravenously (i.v.) with PBS or HDL (100 mg/kg) (n=5). a–c, At least three biological replicates per condition were generated. d,e Data are shown as the mean ±S.E.M, PBS versus HDL **p<0.01, ***p<0.001.

