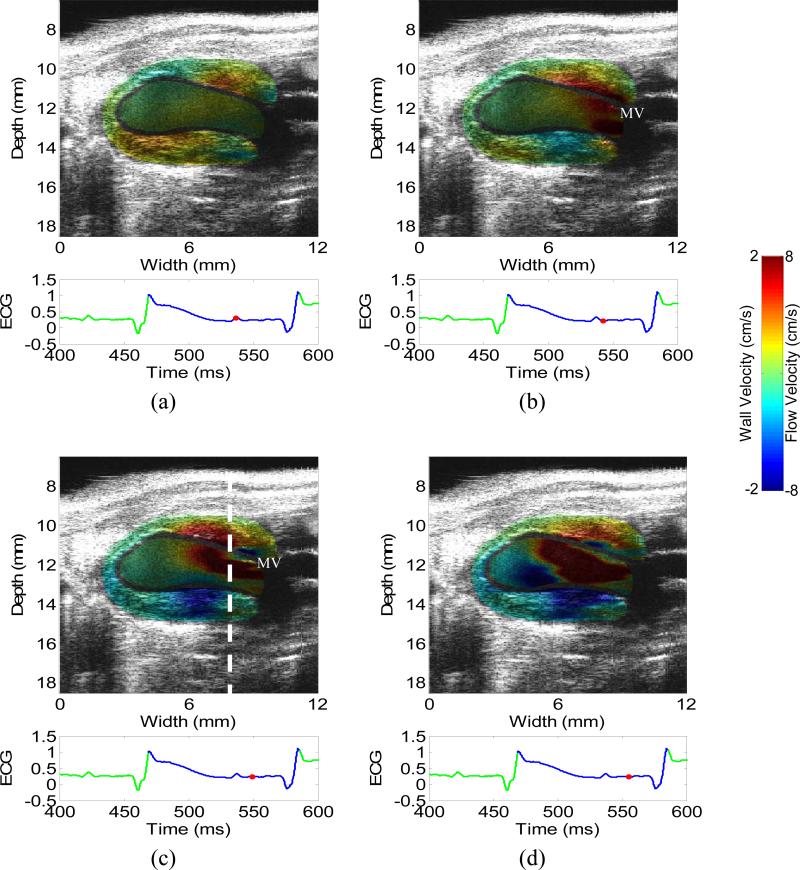
Figure 3.
2-D images of wall velocity and blood velocity in the diastolic phase of a normal heart, with 5 ms apart. (a) is before the mitral valve opens, i.e., isovolumic relaxation phase. (c-d) is immediately after the mitral valve opens, i.e., rapid filling phase. Opposite flows in (d) suggest the formation of a vortex, which was confirmed by the B-mode cine-loop. The dashed line in (c) indicates the location of the M-mode image (Figs. 4(b) and 5(b)). The mitral valve (MV) is visible in (b) and (c).

