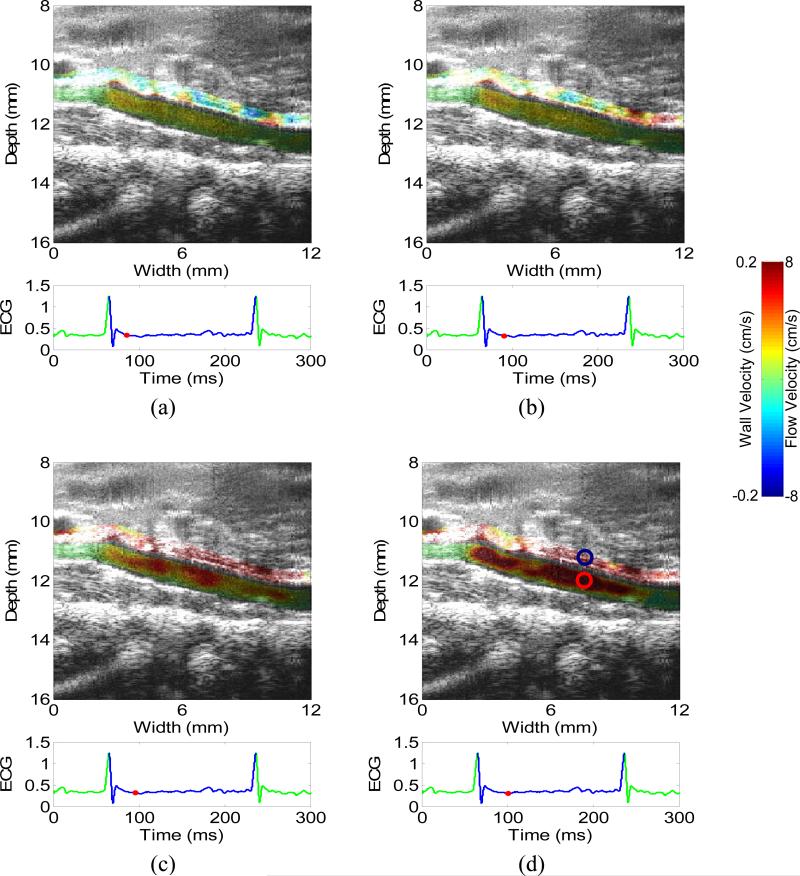
Figure 6.
2-D images of aortic wall velocity and lumen blood velocity in the systolic phase of a normal abdominal aorta (5 ms apart). The circles in (d) indicate where the waveforms in Fig. 7 are taken from. Only the velocities on the anterior aortic wall and the peri-aortic tissue as well as the lumen are shown.

