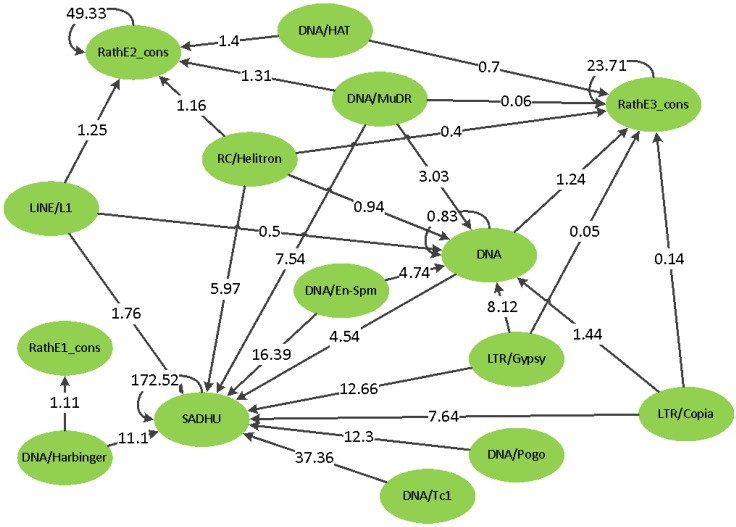
Figure 9.
The SNP to copy number hierarchy from GWAS. The arrows indicate that the SNPs located in the superfamily on the blunt side of the arrow are significantly associated with the copy number of the superfamily on the side of the arrowhead. The number within the arrow is the number of SNPs normalized by the total length of TEs in the corresponding superfamily. There were no cases of arrows traveling in both directions.

