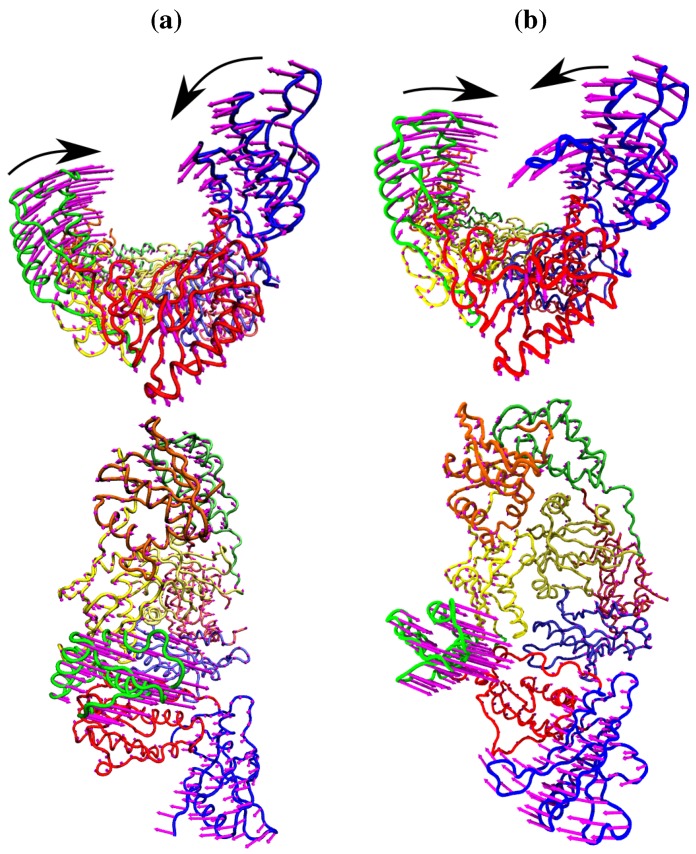
Figure 4.
The fluctuations of the NNRTI bound HIV-1 RT described by the second ANM mode for (a) the EFV bound 1FK9 and (b) NVP bound 1RTH structures. The fluctuations of each residue are shown as magenta arrows. In both cases two views are shown, one above the other; along the DNA binding cleft and looking down into it. In both cases the motions are dominated by anti-correlated movements of the p66 thumb and fingers (as highlighted by the black arrows).

