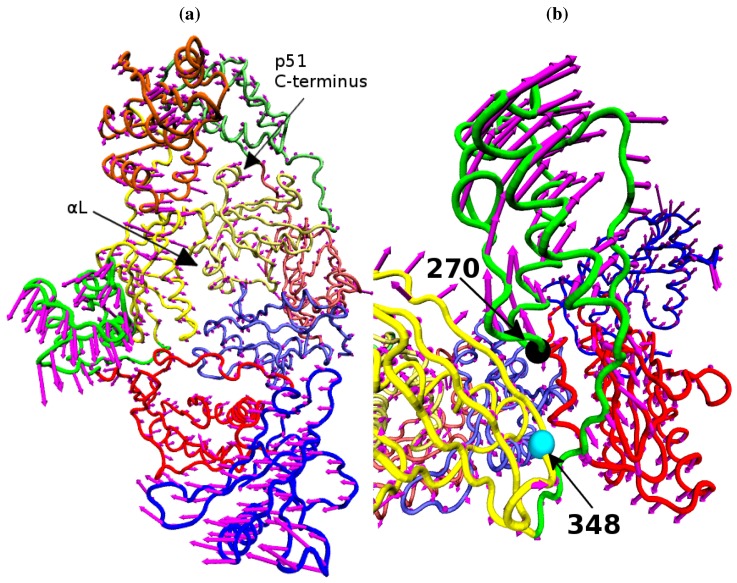
Figure 9.
The variation of the NNRTI bound HIV-1 RT described by PC1. The variation of each residue, relative to the average structure displayed in tube representation, is shown in (a) as magenta arrows. Detail of the changes in their p66 thumb is shown in (b), the Cα atoms of residue 270 (black) and 348 (cyan) are shown as spheres.

