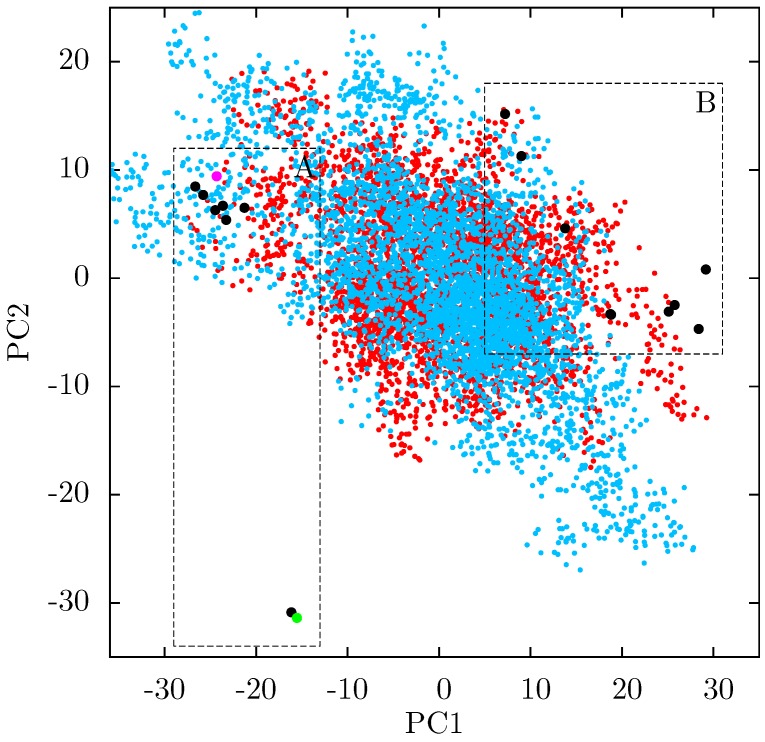
Figure 10.
Projection of snapshots from the ensemble MD trajectories of the EFV and NVP bound HIV-1 RT onto the first two principal components generated from PCA of EFV and NVP bound HIV-1 RT crystal structures. Both simulations show wide variations in both PCs; there is no clustering close to either of the groups of crystal structure projections (these are shown by the dashed rectangles and labelled A and B). Crystal structure projections are shown as black dots, except the 1IKW (green) and 1VRT (magenta) structures which were used as initial structures for the EFV and NVP MD simulations, respectively.

