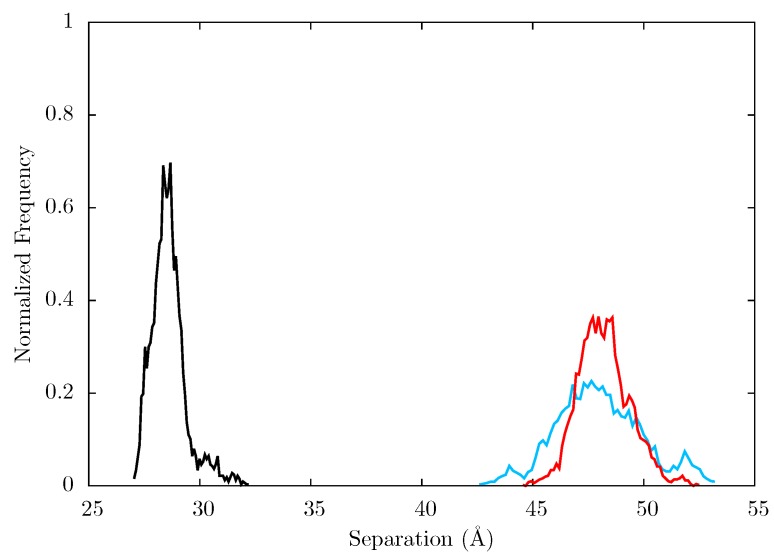
Figure 12.
Histogram showing the normalized frequency distribution of the separation between centres of mass of the p66 fingers and thumb over the simulations of the (black), EFV (red) bound and NVP (blue) bound HIV-1 RT ensemble trajectories. Both the EFV and NVP ensembles maintain much larger separation than is seen in the apo enzyme but the NVP bound system shows greater flexibility.

