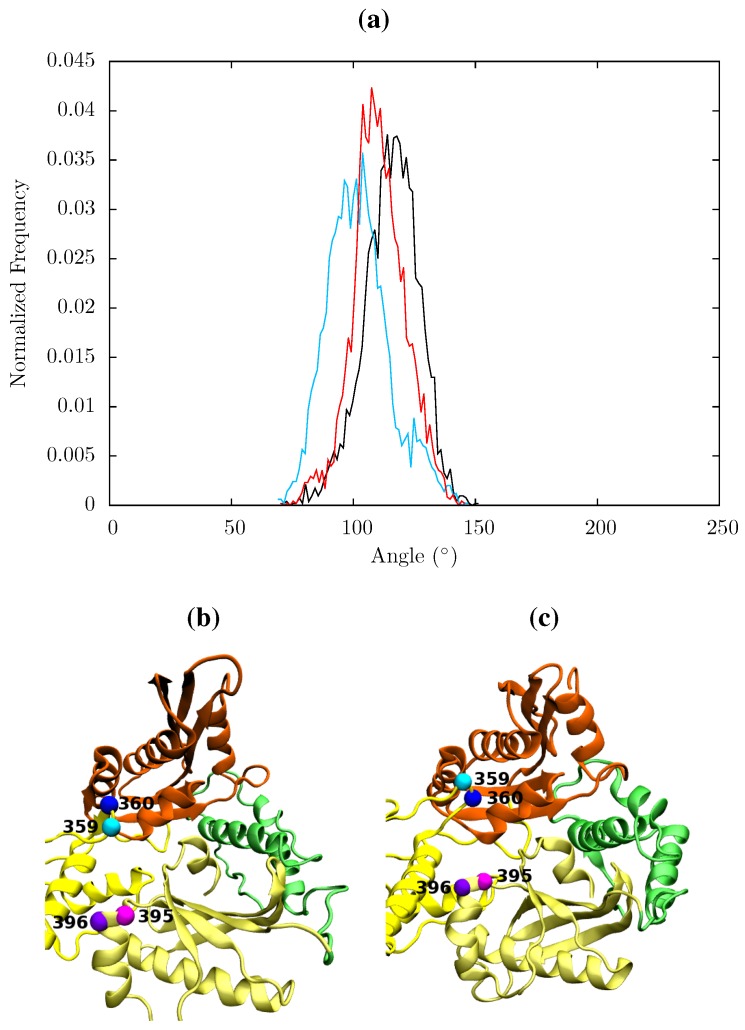
Figure 13.
(a) Histogram showing the normalized frequency distribution of the angle between two pairs of residues (359 and 360 in p66 and 395 and 396 in p51) in the RNaseH primer grip over the simulations of the apo (black), EFV (red) bound and NVP (blue) bound HIV-1 RT ensemble trajectories. The angle is measured between two vectors joining the Cα atoms of the pairs of residues. The distribution is shifted to a lower angle in both NNRTI bound structures. Conformations of the RNaseH primer grip residue pairs 359 and 360 in p66 (shown in cyan and blue, respectively) and 395 and 396 in p51 (in magenta and purple, respectively) are illustrated in (b) from the NVP bound simulation (angle 90°) and (c) form the apo simulation (angle 130°). This shows the that the variation is mainly due to flexibility in the loop containing residues 359 and 360 in p66.

