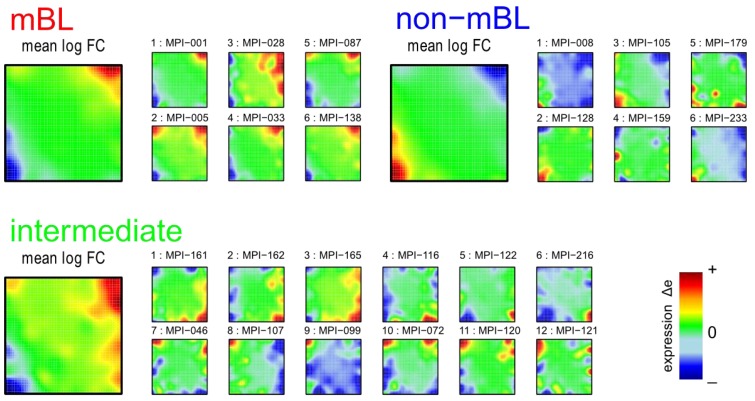
Figure 1.
Self-organizing map (SOM) gallery of lymphoma subtypes with a resolution of 50 × 50 metagenes: The small mosaic images refer to selected individual tumor samples assigned to the mBL, non-mBL and intermediate subtypes. The larger images represent the respective mean subtype portraits (see methodical section). Dark red/blue colored metagenes refer to the 90th/10th-percentile of expression in each sample, respectively. The complete gallery of all sample portraits is available in Supplementary File 2.

