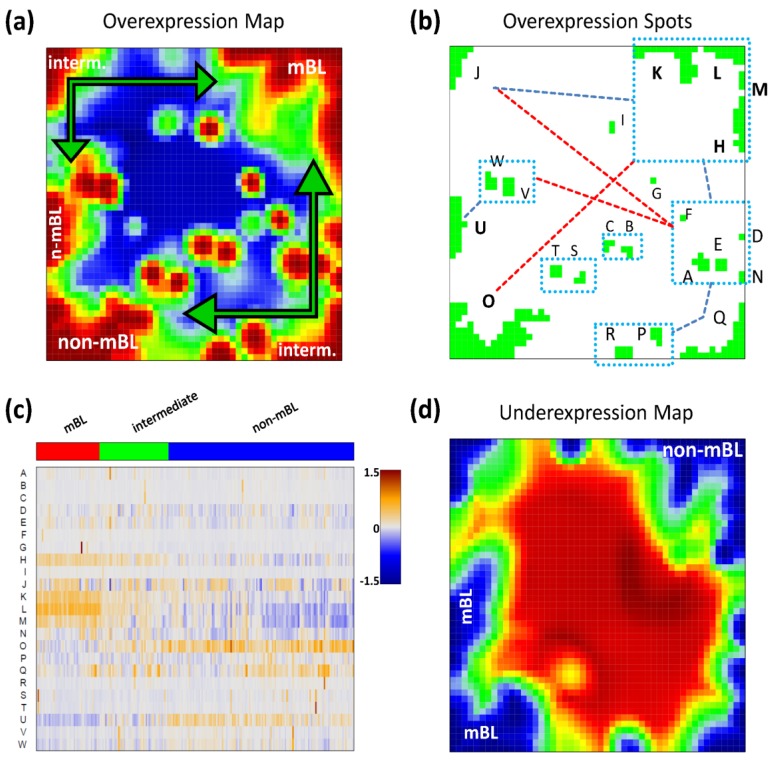
Figure 2.
Spot module characteristics: (a) The over-expression summary map collects all over-expression spots observed in the individual portraits into one map. Subtypes frequently showing the respective spots are indicated. (b) The over-expression spot map defines the spots used for further analysis. Regions beyond the 98th-percentile threshold of metagene expression are selected. The spots are assigned by large capital letters. The blue rectangles include highly correlated spots (r > 0.7). The blue and red dashed lines connect correlated (0.4 < r < 0.7) and anti-correlated (r < −0.6) spots, respectively. (c) The overexpression heatmap shows the mean expression of the spots across all samples in the data set. The samples are sorted according to their subtype. (d) The under-expression summary map collects all under-expressed spots observed in the individual portraits. Note the antagonistic nature of mBL and non-mBL expression: spots over-expressed in mBL become under-expressed in non-mBL and vice versa (compare with panel a).

