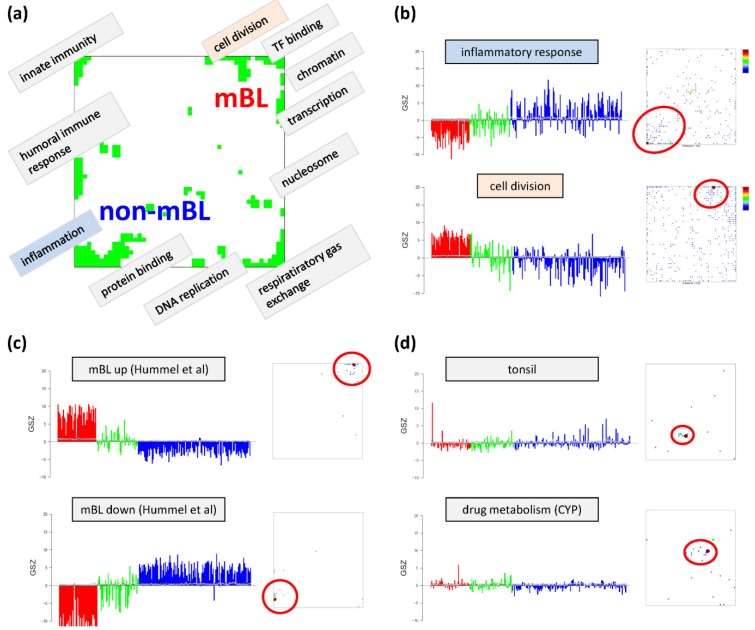
Figure 3.
Functional analysis: (a) The functional context of the most abundant spots is assigned according to the topmost overexpressed gene sets in each of the spots. (b–d) GSZ-profiles and population maps are shown for gene sets accumulating in the mBL and non-mBL specific overexpression spots as indicated by the red ellipses (panel b), for mBL-vs-non-mBL signature sets published previously [10] (c) and for sets accumulating in rare spots (d).

