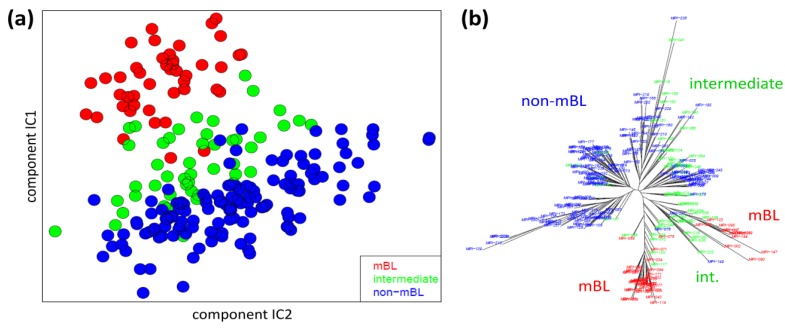
Figure 4.
Sample similarity analysis: (a) Independent component analysis (ICA) of lymphoma samples. The distribution of the samples is shown in the space spanned by the two leading independent components. (b) The neighbor-joining tree projects the sample similarity relations into a dendrogram. The bush-like structures reveal a finer granularity of subtypes beyond the three classes considered so far.

