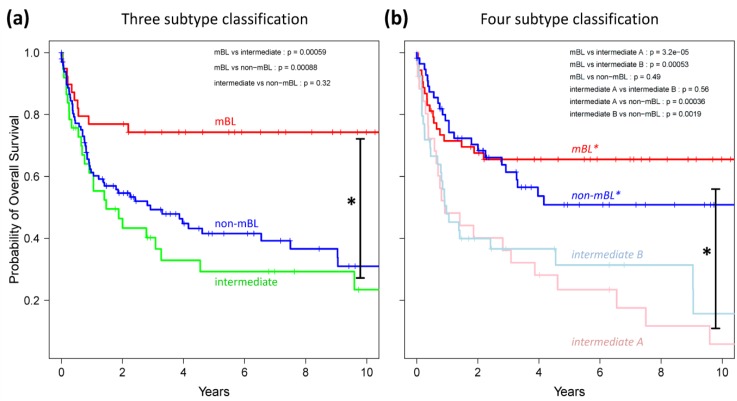
Figure 9.
Kaplan-Meier survival curves of the original three subtypes (a) and the new four subtype (b) classifications. Tick marks indicate patients alive at the time of last follow-up. Subtype specific survival curves are compared using log-rank test and the respective p-values are indicated within the figures.

