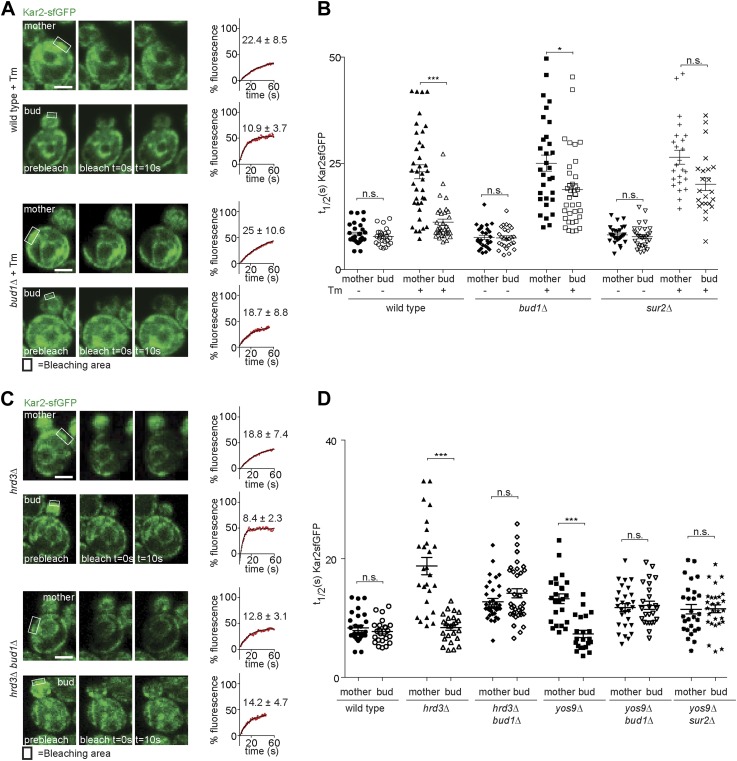
Figure 5. Retention of Kar2 clients in the mother cell depends on the ER diffusion barrier.
(A and C) FRAP of Kar2-sfGFP in the mother or bud of mutants of indicated genotype in the presence or absence of 0.5 µg/ml tunicamycin. (B and D) Graphs indicate the distribution of individual t1/2 values measured in mutant cells of indicated genotype. Representative cells are shown. n > 20 cells. Averages ± SD are indicated. n.s. = not significantly different, ***p<0.0001, *p<0.05 (t test). Scale bars = 2 µm.

