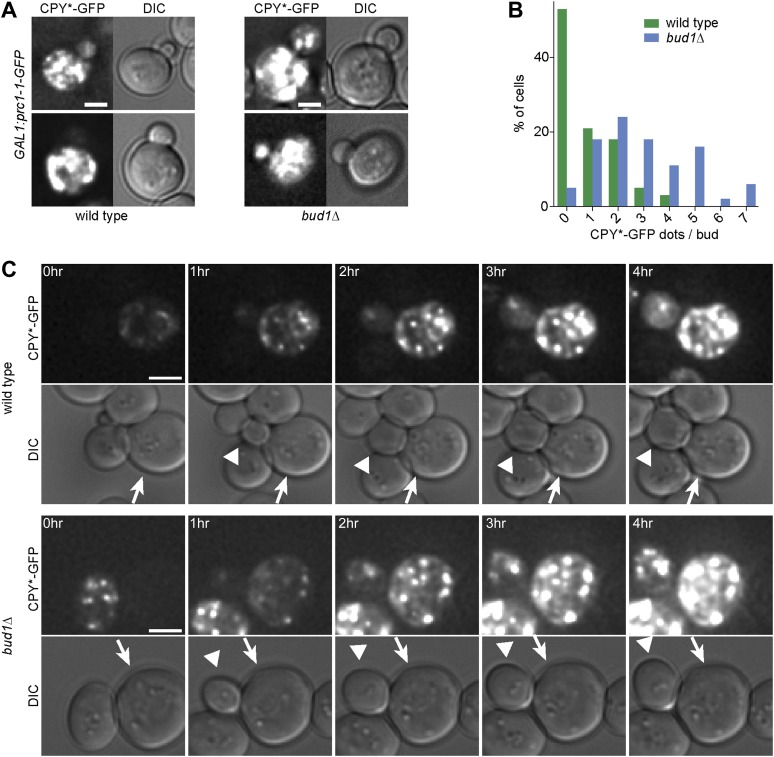
Figure 6. The cER diffusion barrier retains misfolded CPY*-GFP in the mother cell.
(A) Z-stack projections of CPY*-GFP and corresponding DIC images in wild type and bud1Δ mutant cells. (B) Graph shows the frequency of buds with indicated number of CPY*-GFP dots in wild type and bud1Δ mutant cells. (C) DIC and CPY*-GFP fluorescence images of time lapse microscopy of wild type (up) and bud1Δ mutant cells (bottom). The arrow indicates the mother cell and the arrowhead the growing bud. Scale bars = 2 µm.

