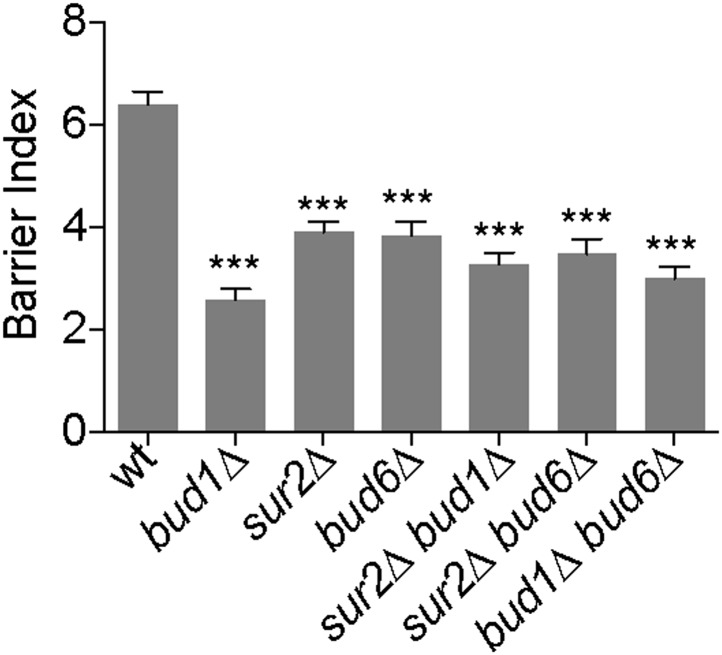
Figure 9. Bud1, Bud6 and Sur2 act in the same pathway for barrier formation.
Graph shows the BI measured by FLIP analysis of Sec61-GFP exchange between mother and bud in cells of indicated genotype, as in Figure 2. BI + SD of tested strains are shown. n > 20 cells. ***p<0.001, (t test).

