Fig. (5).
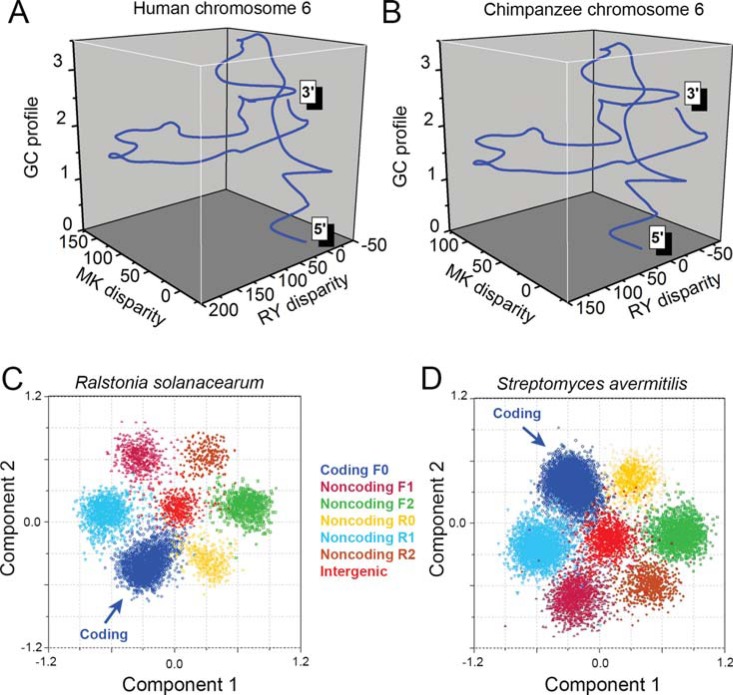
Genomic nucleotide composition features revealed by the Z-curve method. 3-D Z-curves for human chromosome 6 (A) and chimpanzee chromosome 6 (B). The 2 homologous chromosomes show similar Z-curves. To show global nucleotide composition patterns, Z-curves have been smoothed for 50,000 times by using the B-spline function. An ORF-flower phenomenon is revealed by the Z-curve method in genomes with high GC content. All open reading frames are mapped onto a 9-dimensional space using the Z-curve method, and protein-coding ORFs are located in a distinct region, compared with non-coding ORFs and intergenic sequences. Shown are principal component analysis for the genomes of Ralstonia solanacearum GMI1000 (C) and Streptomyces avermitilis MA 4680 (D). F0, F1, F2, R0, R1, and R2 stand for reading frames of protein-coding, forward 1, forward 2, non-coding reverse 0, reverse 1 and reverse 2, respectively.

