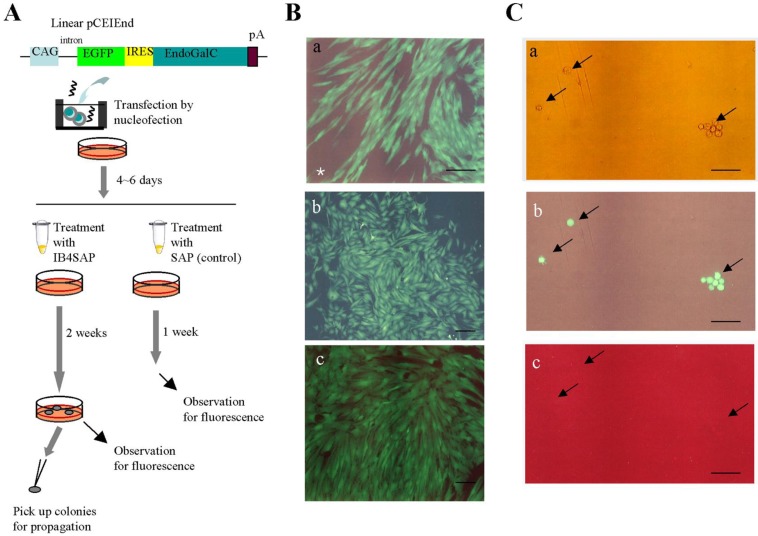
Figure 3.
(A) Experimental flow for examining whether enrichment of cells with high transgene expression can be achieved with IB4SAP treatment. Abbreviations are the same in Figure 2A. (B) Micrographs taken under light + UV illumination. (a), The cells obtained one week after SAP treatment; and (b) and (c), the emerging colonies obtained two weeks after IB4SAP treatment. In (a), a mixture of fluorescent cells (successfully transfected with pCEIEnd) and nonfluorescent untransfected cells is indicated by an asterisk. The cells in (b) and (c) are from two independent colonies. Bar = 100 μm. (C) Dissociated cells isolated from a colony described in (c) of B. These cells were then stained with AF594-IB4. The arrows indicate the isolated cells in (a) showing bright green fluorescence (b) but negative for lectin staining (c). (a), photograph taken under light; (b) and (c), photographs taken under light + UV illumination. Bar = 100 μm.

