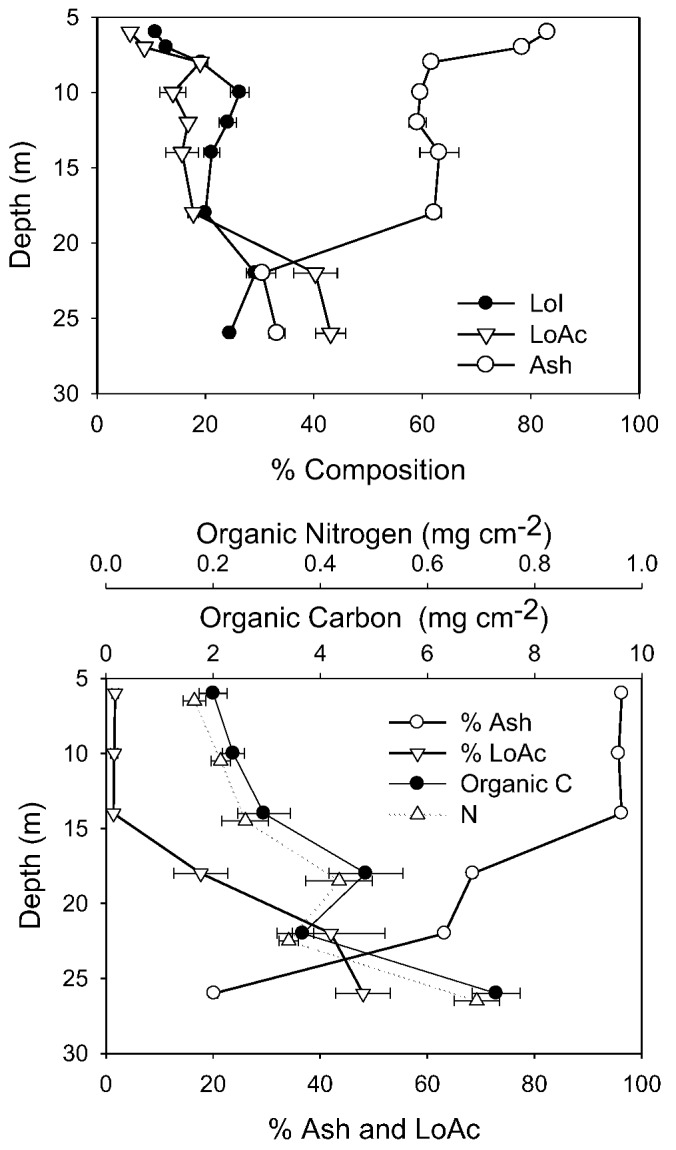
Figure 5.

Biomass-related variables from 1998 and 2010. In 1998 (top) only % composition was measured, and all depths refer to the “active layer” of mats only. In 2010 (bottom), all depths, except 26 m, comprised cores to the underlying coarse sediments and were normalized to unit area. The 26 m sample represents only the active layer. In each case, the mean and standard deviation are plotted (n = 5).
