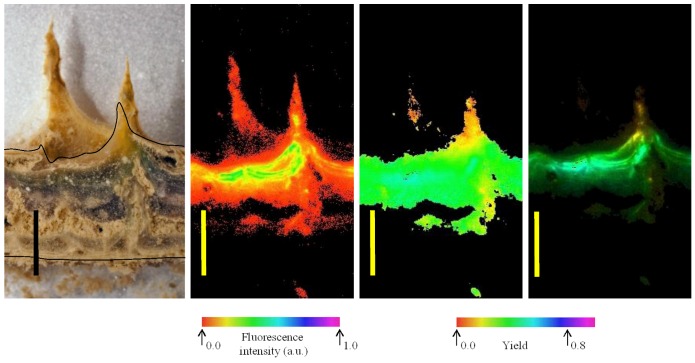
Figure 6.
Distribution of fluorescence intensity (minimum fluorescence yield [Fo]—second image from left) and maximum yield of photosystem II (the maximum quantum yield of PSII [Fv/Fm]—third image) in part of a vertical section of a mat from 10 m depth. At far right is a maximum fluorescence yield (Fm)-weighted yield image, where the false color represents the yield and the intensity represents Fm. Color scales below fluorescence images represent imaging pulse amplitude modulated (PAM)-derived false-color values. At far left is a photographic image of the mat section at the same scale on which the annotated line shows the outline of the cut surface. Scale bars are 5 mm.

