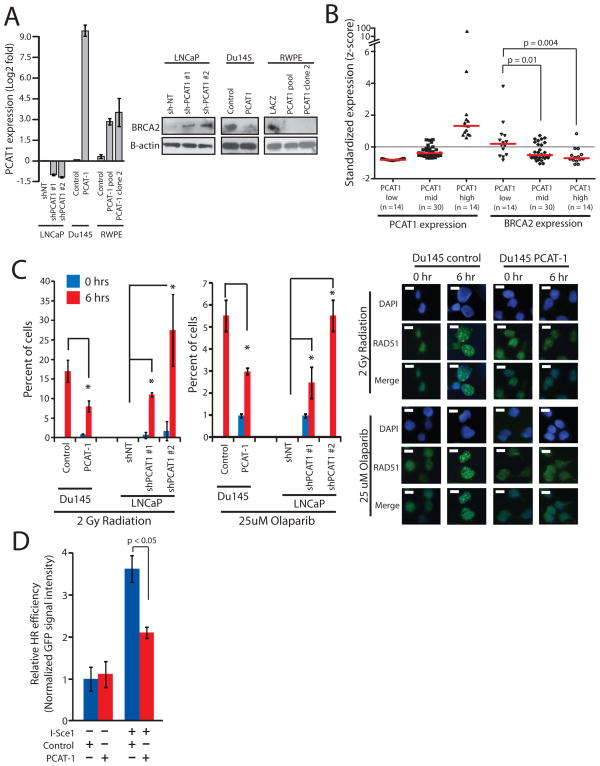
Figure 1.
PCAT-1 expression leads to defective homologous recombination in prostate cells. A, Left, Expression level of PCAT-1 by qPCR in three isogenic cell lines with overexpression (Du145, RWPE) or knockdown (LNCaP) of PCAT-1. Error bars indicate S.E.M. Right, Western blot analysis of BRCA2 in three isogenic cell lines with overexpression (Du145, RWPE) or knockdown (LNCaP) of PCAT-1. B, Expression of PCAT-1 and BRCA2 in a cohort of prostate cancer patients. Expression is shown as z-scores and stratified by increasing PCAT-1 expression. P values are determined by a Mann-Whitney U test. C, Left, Quantification of RAD51 foci in isogenic Du145 and LNCaP cell lines following 2 Gy of radiation or treatment with 25uM Olaparib. For LNCaP cell line models, cells with > 5 foci per cell were quantified. For Du145 cell line models, cells with > 10 foci per cell were quantified. Error bars represent standard deviation. An asterisk (*) indicates p < 0.05 by Student’s t-test. Right, Induction of RAD51 foci in Du145-PCAT-1 cells following 2 Gy of ionizing radiation or treatment with 25uM Olaparib. D, I-SceI-mediated GFP HR assay in PC3-PCAT-1 cells compared to matched control cells. Error bars represent S.E.M.

