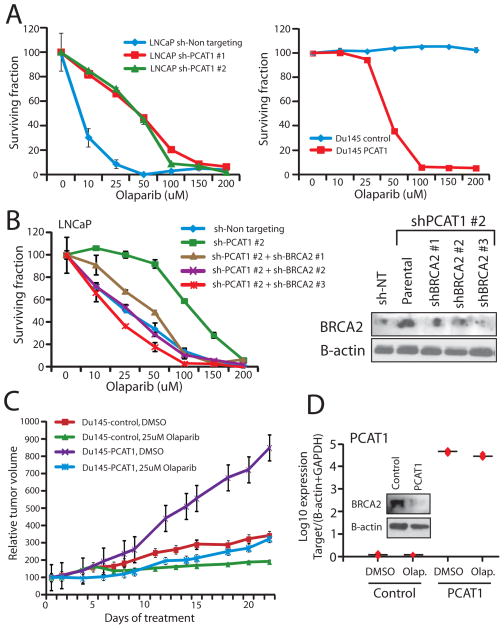
Figure 3.
PCAT-1 expression results in prostate cell sensitivity to PARP inhibition in vitro and in vivo. A, Left, LNCaP cells with PCAT-1 knockdown exhibit enhanced cell survival 72 hrs post-treatment with Olaparib. Right, Du145 cells with PCAT-1 overexpression exhibit reduced cell survival 72 hrs post-treatment with Olaparib. Cell survival is determined via WST assays. B, BRCA2 knockdown in LNCaP shPCAT-1 cells rescues cell sensitivity to Olaparib. An inset Western blot showing efficiency of BRCA2 knockdown is included. C, Tumor growth curves for Du145-control and Du145-PCAT-1 xenografts following initiation of treatment with DMSO control or 25uM Olaparib. Tumor volumes are normalized to 100, and time = 0 represents the start of treatment administration. Treatment was initiated three weeks after xenograft engraftment. D, Expression level of PCAT-1and BRCA2 protein in Du145-PCAT-1 xenografts. Error bars in this figure represent +/− S.E.M.

