Figure 2.
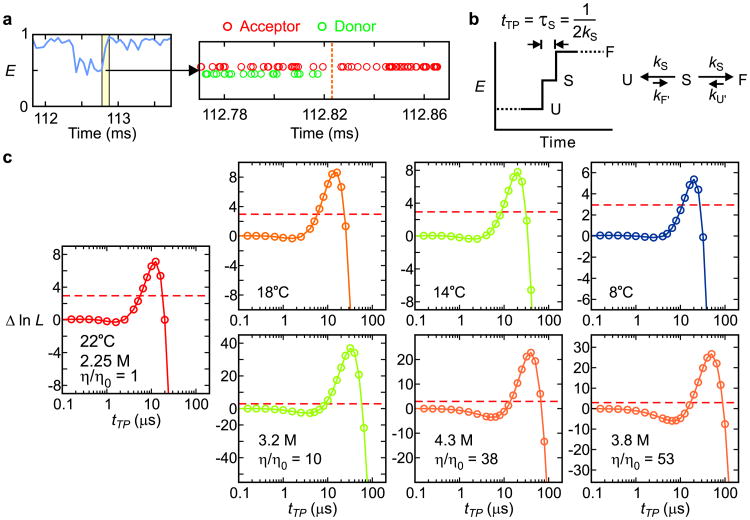
Determination of transition path times. a, A FRET efficiency trajectory (50 μs bin time) with photon trajectory of the yellow segment. b, Schematic of a FRET efficiency trajectory using a one-step model to describe the transition path from unfolded (U) to folded (F) states for a two-state protein. The average transition-path time, tTP, is equal to the lifetime of a virtual intermediate state S (τS = (2kS)-1). c, The difference of the log likelihood, Δln L = ln L(tTP) − ln L(0), plotted as a function of tTP for folding and unfolding transitions at different temperatures (upper row, 2.25 M guanidinium hydrochloride, GdmCl) and at different solvent viscosities at 22°C (lower row). L(0) is the likelihood for a two-state model with instantaneous folding and unfolding transitions. Therefore, Δln L quantifies how much better or worse the one-step model with a finite transition path time in (b) describes the photon trajectory than a two-state model with an instantaneous transition (Extended Data Fig. 2b). The maximum values of Δln L of all data are much greater than the 95% confidence limit (horizontal dashed line at Δln L = 3), which indicates that the transition-path times determined by the maximum of Δln L (Extended Data Table 1 and 2) are highly statistically significant. The number of transitions analyzed were 522 (22°C), 355 (18°C), 265 (14°C), 284 (8°C), 699 (η/η0 = 10), 541 (η/η0 = 38), and 423 (η/η0 = 53).

