Figure 3.
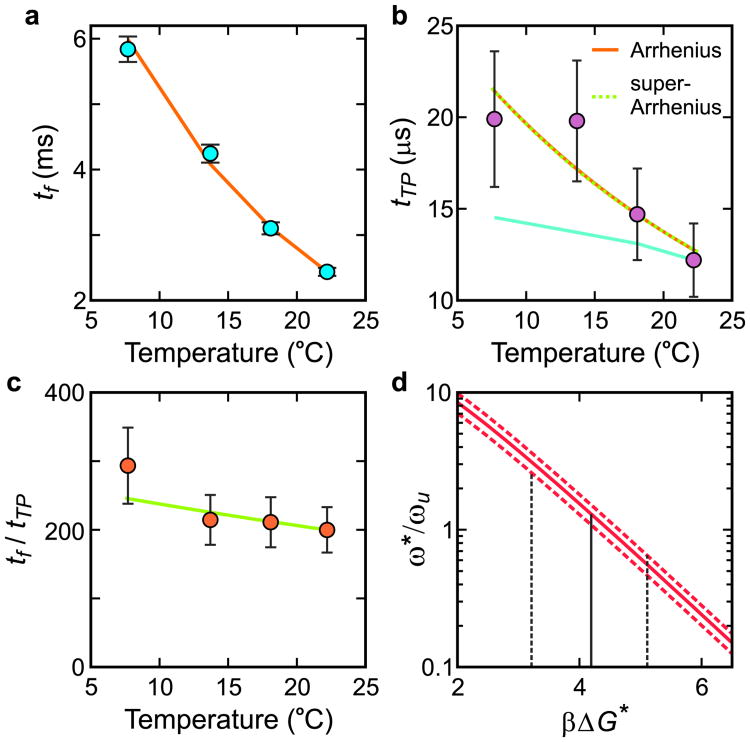
Temperature dependence of folding and transition path times at 2.25 M GdmCl. a, Folding time. The points are the data, and the solid curve is the fit with an Arrhenius law. b, Transition path time. The points are the data, and the orange solid and green dashed curves are the fits with an Arrhenius and a super Arrrhenius law (see text), which are indistinguishable over this small temperature range. The cyan line is the predicted transition path time scaled to the transition path time at 22°C using equation (2) if the solvent were the only source of friction affecting the diffusion coefficient, D*. c, Ratio of folding to transition path times vs temperature. The points are the data and the solid curve is the temperature dependence with ΔG * = 4.2 kBT at 22°C obtained in (d). d, Determining βΔGf* at 22°C. The value of ω*/ωu is evaluated for the measured tf/tTP, 200 (continuous red curve), including its error, i.e. 233 (upper red dashed curve), and 167 (lower red dashed curve). The most probable value of ω*/ωu obtained from the MD simulations7 is 1.3, corresponding to βΔGf* = 4.2. (See Methods)

