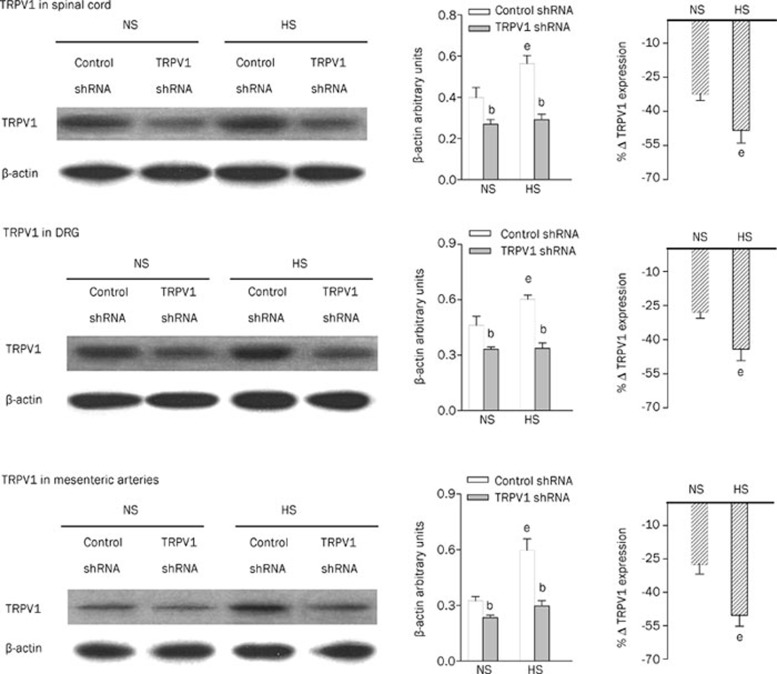
Figure 3.
Western blot analysis showing TRPV1 expression in the dorsal horn of the spinal cord (T8-L3), DRG (T8-L3), and mesenteric arteries of rats fed a NS or HS diet 3 d after control or TRPV1 shRNA treatment. The left, middle, and right panels indicate representative Western blots, quantification results (β-actin arbitrary units), and the percentage change of TRPV1 expression of TRPV1 shRNA from that of corresponding control shRNA, respectively. Values are expressed as mean±SEM (n=5). bP<0.05 compared with the corresponding control shRNA-treated group; eP<0.05 compared with the corresponding NS diet group.

