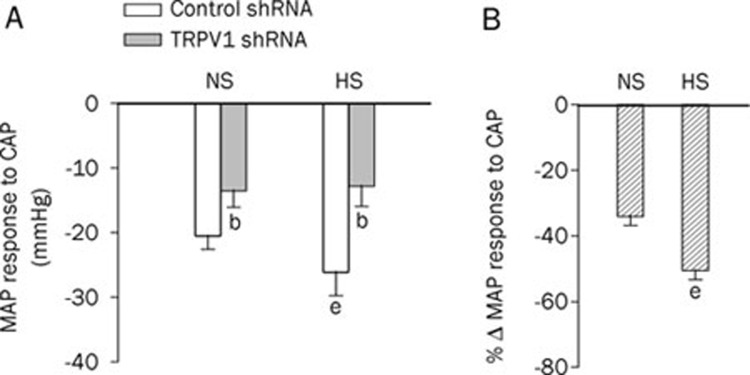
Figure 4.
The response of mean arterial pressure (MAP) at 36 s to a bolus injection of capsaicin (30 μg/kg, iv) in NS rats and HS rats 3 d after administration of control or TRPV1 shRNA (A) and the percentage change of MAP in response to capsaicin following TRPV1 shRNA compared with corresponding control shRNA (B). Values are expressed as mean±SEM (n=6 to 7). bP<0.05 compared with the corresponding control shRNA-treated group; eP<0.05 compared with the corresponding NS diet group.

