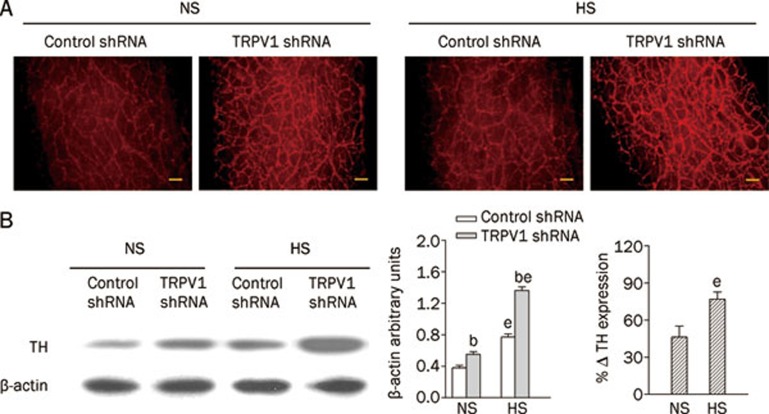
Figure 6.
Immunohistochemistry staining (A) and Western blot analysis (B) showing tyrosine hydroxylase expression in mesenteric arteries of rats fed a NS or HS diet 3 d after either control or TRPV1 shRNA treatment. The left, middle, and right panels in (B) indicate representative Western blots, quantification results (% β-actin arbitrary units), and the percentage change of TH expression in rats receiving TRPV1 shRNA compared with control shRNA, respectively. Values are expressed as mean±SEM (n=5). bP<0.05 compared with the corresponding control shRNA-treated group; eP<0.05 compared with the corresponding NS diet group. Scale bars, 100 μm.

