
Figure 5. Overexpression of PiT-2 in PiT-1 knockdown human aortic VSMCs.
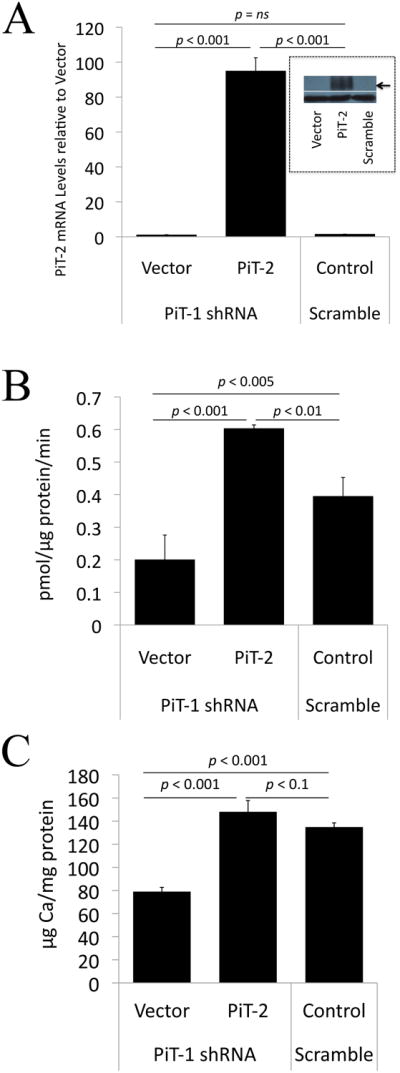
(A) PiT-2 levels in PiT-1 knockdown (PiT-1 shRNA-treated) human VSMCs transduced with vector alone (Vector) or PiT-2 cDNA (PiT-2), or control VSMCs treated with scrambled shRNA (Scramble). Graph shows PiT-2 mRNA levels as determined by qPCR, expressed as PiT-2 mRNA levels relative to Vector. Inset shows PiT-2 protein levels (upper panel; arrow) and b-tubulin loading control (lower panel) as determined by Western blotting (B) Restoration of phosphate (Pi) uptake by PiT-2 overexpression in PiT-1-knockdown cells. Phosphate uptake was measured in 0.1mmol/L phosphate in a 30 min period. (C) Restoration of phosphate-induced calcification by PiT-2 overexpression in PiT-1-knockdown cells. Data are mean ± s.d., n=3 per group.