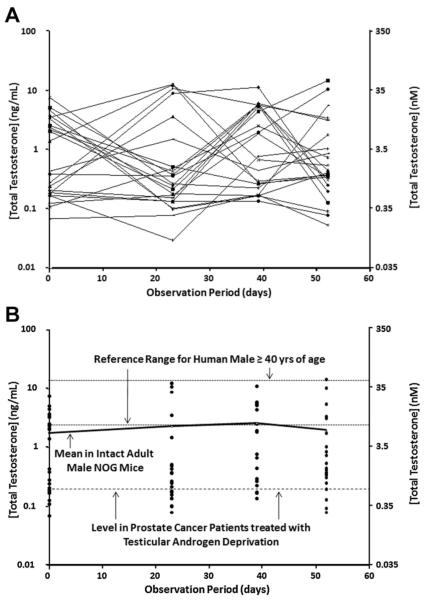
Fig. 3.
Variation in serum total testosterone (expressed as ng/ml on left-axis and as nM on right-axis) over a 54-day observation period for 21 immune deficient intact adult male NOG mice. A: Each line is an individual NOG mouse followed longitudinally. B: Same NOG mouse data presented cross-sectionally and compared to the 95% reference range for human males age 40–80 derived from Mohr et al. [8] and for prostate cancer patients treated with testicular androgen deprivation derived from Morote et al. [23]. Solid line is the mean for the group at the indicated time point.

