Figure 5.
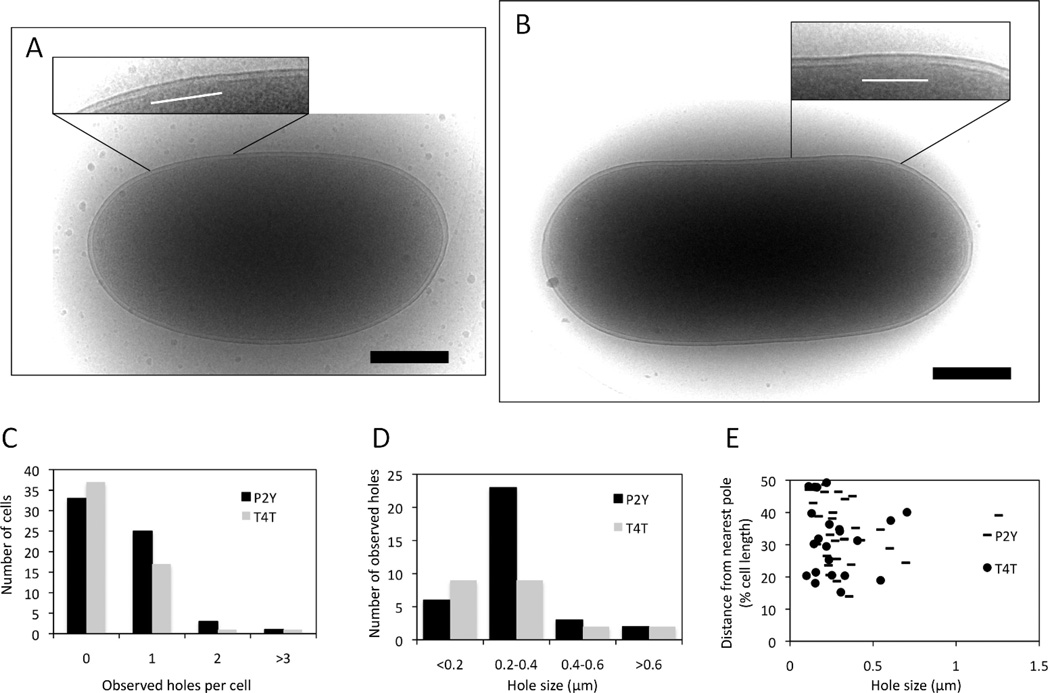
Hole formation by different holins. (A) E. coli MC4100 ΔtonA λCamΔSR cells carrying a plasmid isogenic to pS105RamRzamRz1am but with the indicated heterologous holin gene substituted for S105 were thermally induced, sampled and analyzed as described for Fig. 2. (A) P2 Y; (B) T4 t. Insets: close-up views of the areas in which inner membrane lesions are observed. The white lines indicate the location and extent of the lesions Scale bars correspond to 500 nm. (C) Number of holes/cell for P2 Y and T4 T. (D) Hole size distribution for P2 Y and T4 T. (E) Hole distance from nearest pole for P2 Y and T4 T.

