Figure 1.
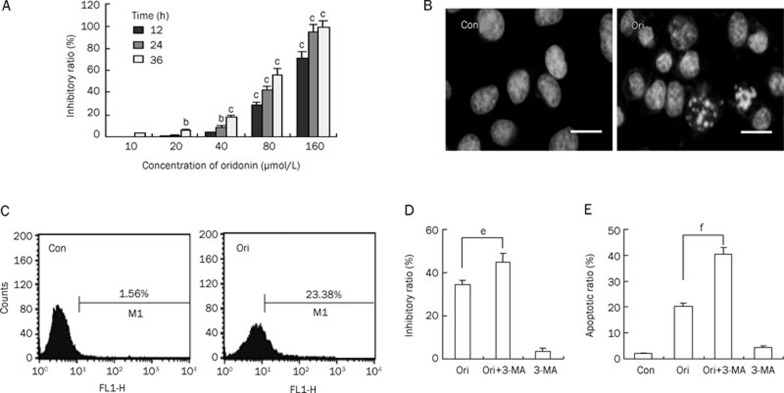
Oridonin induced apoptosis and autophagy in HeLa cells. (A) The cells were treated with various doses of oridonin for 12, 24, or 36 h. The cell growth inhibition ratio was measured by MTT assay. n=3. Mean±SD. bP<0.05, cP<0.01 vs control group. (B) The cells were treated with 80 μmol/L oridonin for 24 h and the changes in cellular morphology were observed by fluorescence microscopy with Hoechst 33258 staining (×400 magnification, Bar=10 μm). (C) The ratio of MDC-positive cells was measured by flow cytometric analysis after the cells were incubated with 80 μmol/L oridonin for 24 h. The FACScan histograms are shown. (D–E) The cells were treated with 80 μmol/L oridonin for 24 h in the presence or absence of 2 mmol/L 3-MA, the cell growth inhibition ratio (D) was measured by MTT assay, and the apoptotic cells were measured by flow cytometry analysis that detected Annexin V/PI staining. The apoptotic ratio (E) represents the addition of the proportion of Annexin V positive cells and the proportion of PI-positive cells. n=3. Mean±SD. eP<0.05, fP<0.01 vs oridonin group. Con: control, Ori: oridonin.

