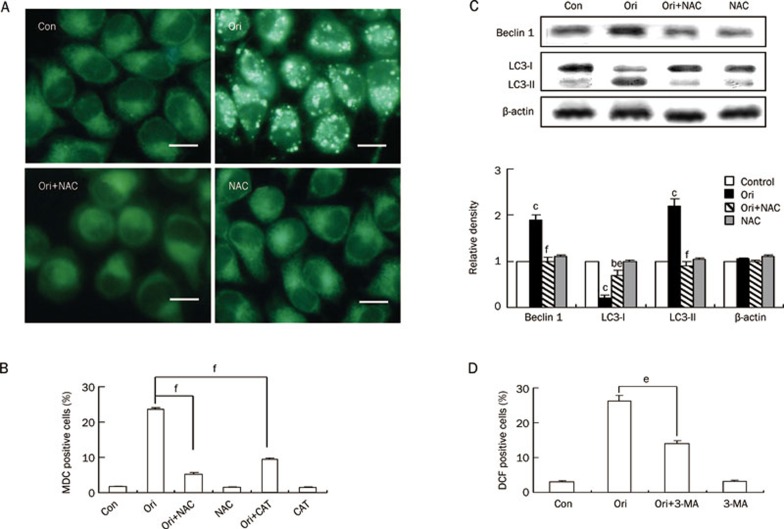
Figure 7.
Effect of ROS on oridonin-induced autophagy in HeLa cells. (A–C) The cells were treated with 80 μmol/L oridonin for 24 h in the presence or absence of 5 mmol/L NAC or 1000 U/mL CAT. (A) The changes in cellular morphology were observed by fluorescence microscopy with MDC staining (×400 magnification, Bar=10 μm). (B) The autophagic ratio was measured by flow cytometric analysis. n=3. Mean±SD. fP<0.01 vs oridonin group. (C) The protein levels of Beclin 1 and MAP-LC3 were detected by Western blot analysis, and the corresponding histograms quantified by densitometry were expressed at the bottom. n=3. Mean±SD. bP<0.05, cP<0.01 vs control group; eP<0.05, fP<0.01 vs oridonin group. Each experiment was performed at least three times, and β-actin was used as a loading control. (D) The cells were treated with 80 μmol/L oridonin for 24 h in the presence or absence of 2 mmol/L 3-MA and the DCF-positive cells was measured by flow cytometric analysis. n=3. Mean±SD. eP<0.05 vs oridonin group.

